Stidham Lab

Dr. Ryan Stidham, MD, MSc
About
Dr. Stidham's research focuses on improving the ways that we monitor Crohn's disease and ulcerative colitis. Knowledge of disease activity can help determine if current medicines are sufficient, if a change in therapy is needed, or if we can reduce therapy. Knowing disease activity may also be able to predict a flare of disease prior to developing symptoms. Finally, we seek to develop new markers of disease activity that are minimally invasive, low cost, and can be performed in a doctor's office.
Research
Ultrasound Elasticity Imaging in Crohn's Disease
A major problem in Crohn's disease is that recurrent inflammation over long periods of time can cause significant scarring of the intestine, which we call fibrostenotic, or structuring disease. Scarred intestine is not believed to respond to available medications and surgery is required for treatment. However, fibrostenotic disease appears nearly identical to inflamed intestine. Even with colonoscopy, CT scans, and MRIs, it is not possible to distinguish inflamed from scarred fibrostenotic bowel. Why do we care? Because knowing how much scar is present may have enormous implications for predicting if a patient will respond to medical therapy.
Using modified ultrasound technology, we may be able to determine the stiffness of the intestine and potentially determine if an individual's Crohn's disease will respond to medical therapy. This diagnostic tool requires no IV or medications, no bowel prep, no fasting, and is performed in the office.
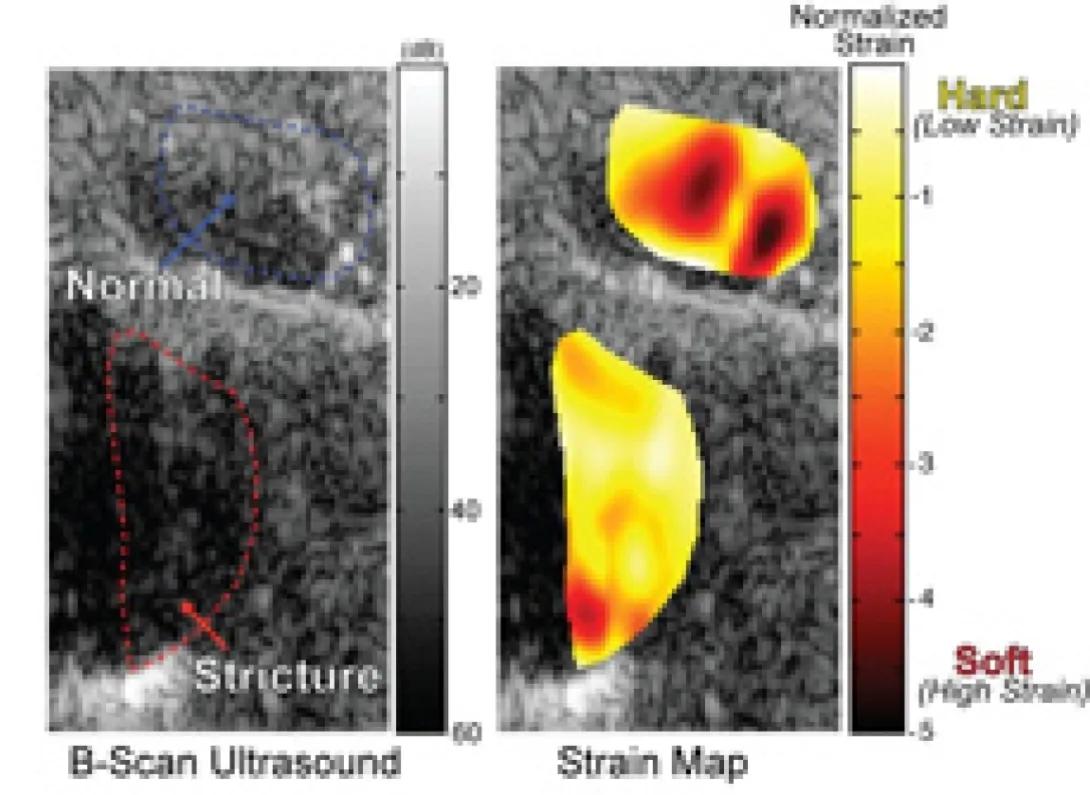
UEl strain measurement distinguishes normal bowel from fibrotic bowel in human subjects with Crohn's Disease.
This image depicts a comparative analysis of tissue stiffness using B-scan ultrasound imaging and a corresponding strain map.
Key Components:
1. B-Scan Ultrasound (Left Panel):
Normal Tissue (Blue Outline):
Identifies an area of normal tissue structure with expected echogenicity and architecture.
Structure with Abnormality (Red Outline):
Highlights an abnormal tissue region (labeled "Structure"), suggesting changes in tissue properties, such as fibrosis or other pathological alterations.
Grayscale Intensity:
Represents tissue density and reflects acoustic impedance variations in the scanned area.
2. Strain Map (Right Panel):
Color-Coded Map:
Visualizes the relative stiffness of tissues using normalized strain measurements:
Red/Yellow Areas: Indicate stiff tissue (low strain, harder areas).
White Areas: Moderate strain.
Dark Orange/Red Areas: Softer tissue (higher strain).
Tissue Stiffness Interpretation:
Harder tissues correlate with lower strain values (e.g., fibrotic regions), while softer tissues exhibit higher strain.
3. Normalized Strain Scale (Right Color Bar):
Gradient Scale:
Ranges from hard (low strain) at the top (yellow) to soft (high strain) at the bottom (red).
Helps to interpret the relative differences in tissue stiffness across the analyzed regions.
Purpose of the Image:
Combines ultrasound imaging with strain analysis to detect and differentiate between normal and pathological tissues.
Biomarkers of Intestinal Fibrosis in Crohn's Disease
We are searching for proteins in the blood that reflect intestinal fibrosis or scarring. With goals similar to those in our ultrasound studies, we are interested in developing minimally invasive ways to predict fibrosis and subsequently predict the likelihood of medication response early in the disease.
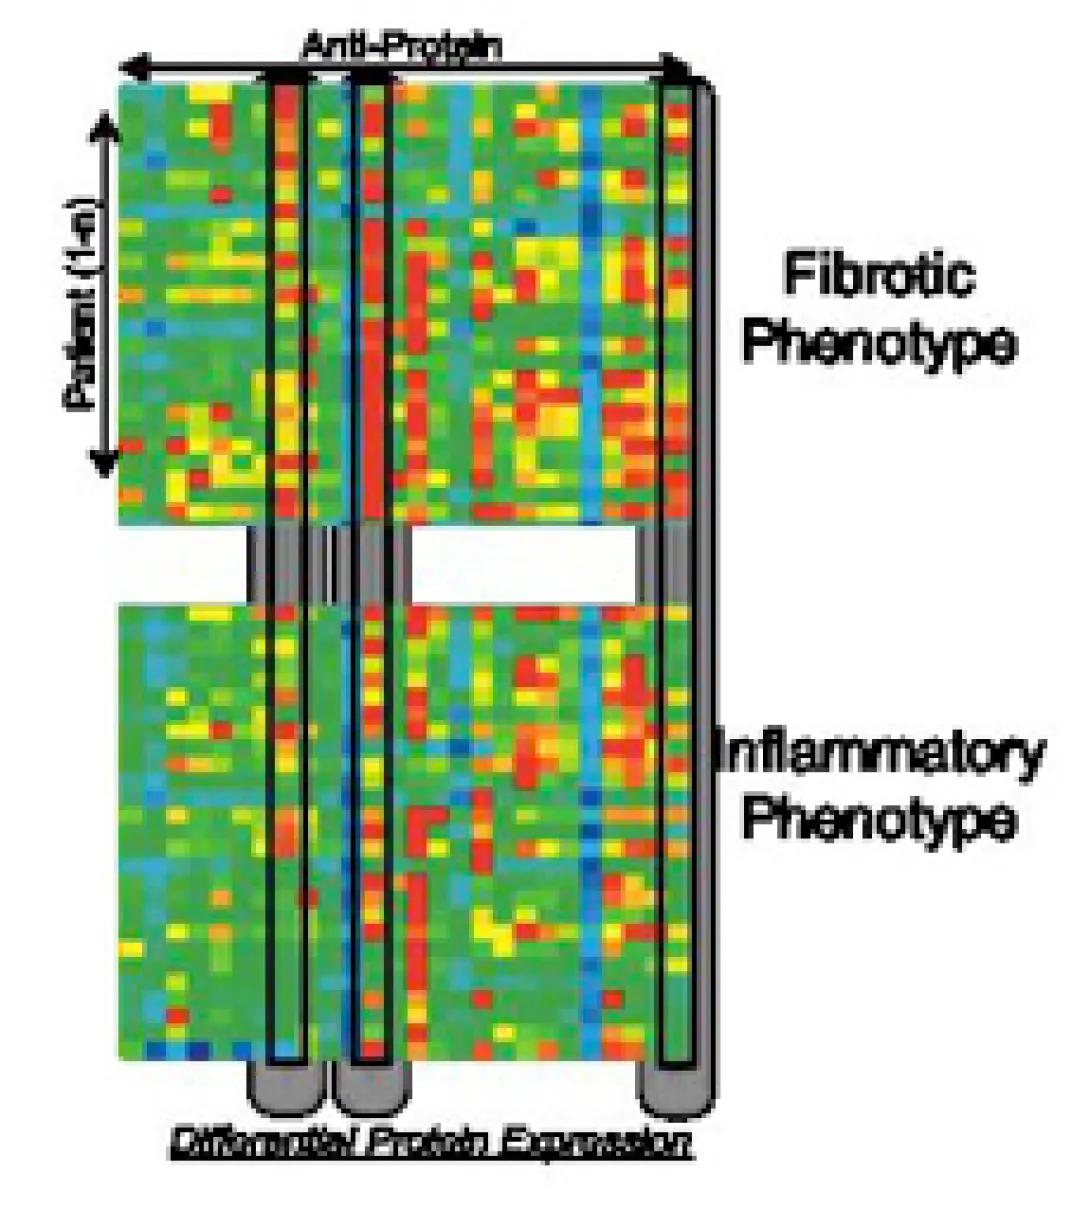
This infographic represents a heatmap that visualizes the differential protein expression of patients, categorized into two distinct phenotypes: Fibrotic Phenotype and Inflammatory Phenotype.
Here is a detailed breakdown:
Key Components:
Axes:
Vertical Axis (Patients):
Represents individual patients, likely arranged based on clustering or similarity in protein expression profiles.
Horizontal Axis (Anti-Proteins):
Represents specific proteins or biomarkers being analyzed for their differential expression.
Heatmap Colors:
Color Coding:
Red: Indicates high protein expression levels.
Green: Indicates low protein expression levels.
Yellow/Blue: Likely intermediate expression levels, highlighting variability across the dataset.
The color variation shows the range of expression intensity for each protein in each patient.
Phenotypes:
Fibrotic Phenotype:
Patients grouped on one side based on protein expression patterns associated with fibrotic characteristics.
Inflammatory Phenotype:
Patients grouped on the other side, linked to inflammation-related protein expression profiles.
Clustering:
The clustering of proteins and patients suggests a correlation between certain proteins and the phenotypic classification (fibrotic or inflammatory).
Purpose of the Heatmap:
This visualization serves to:
- Identify key proteins or biomarkers associated with fibrotic and inflammatory phenotypes.
- Distinguish patient subgroups based on underlying molecular patterns.
- Aid in stratifying patients for targeted therapeutic approaches.