Publications | MiOTO
Key Publications
Explore significant peer-reviewed work from the lab.
Highlighted Publications
Approaches that Advanced Genetically Defined Models in Head & Neck Cancer
Discovery of urine-based ctDNA
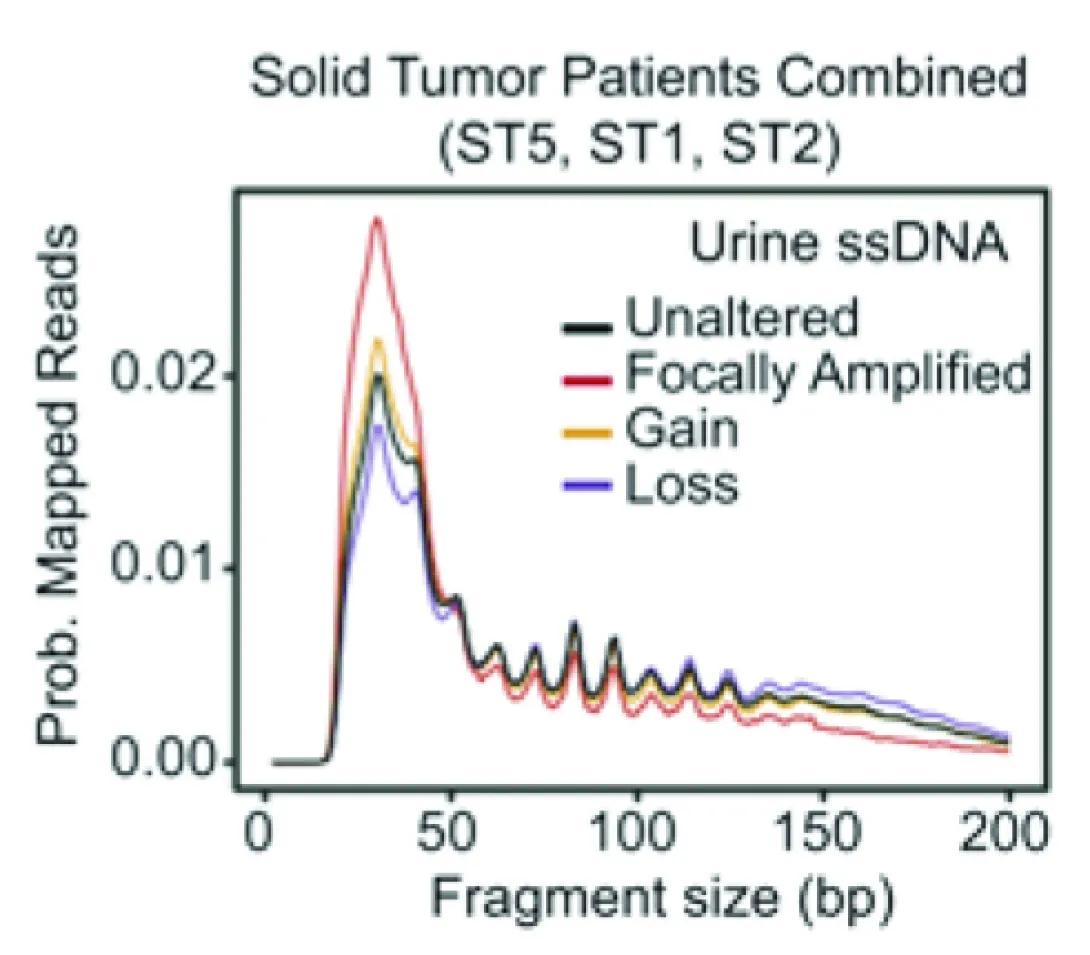
Line graph comparing urine single-stranded DNA (ssDNA) fragment sizes in solid tumor patients. The x-axis shows fragment size in base pairs (bp) from 0 to 200. The y-axis shows probability of mapped reads from 0.00 to 0.02. Four lines represent different genetic alteration categories:
Black: Unaltered
Red: Focally Amplified
Gold: Gain
Blue: Loss
All groups show a sharp peak near 40 bp, followed by smaller repeating peaks that gradually decline toward 200 bp. The red “Focally Amplified” line has the highest initial peak, while the other lines follow slightly lower but similar patterns.
Our study found that tiny pieces of tumor DNA, called ultrashort TR-ctDNA, can be detected in urine and used to find cancer—without needing a blood draw. We created a special test to detect this DNA in patients with HPV-related throat cancer and showed that urine can be just as reliable as blood for spotting the disease. This approach could make cancer detection easier, more comfortable, and even possible from home in the future.
Discovery of recurrent TERT rearrangements in Mucoepidermoid Carcinoma
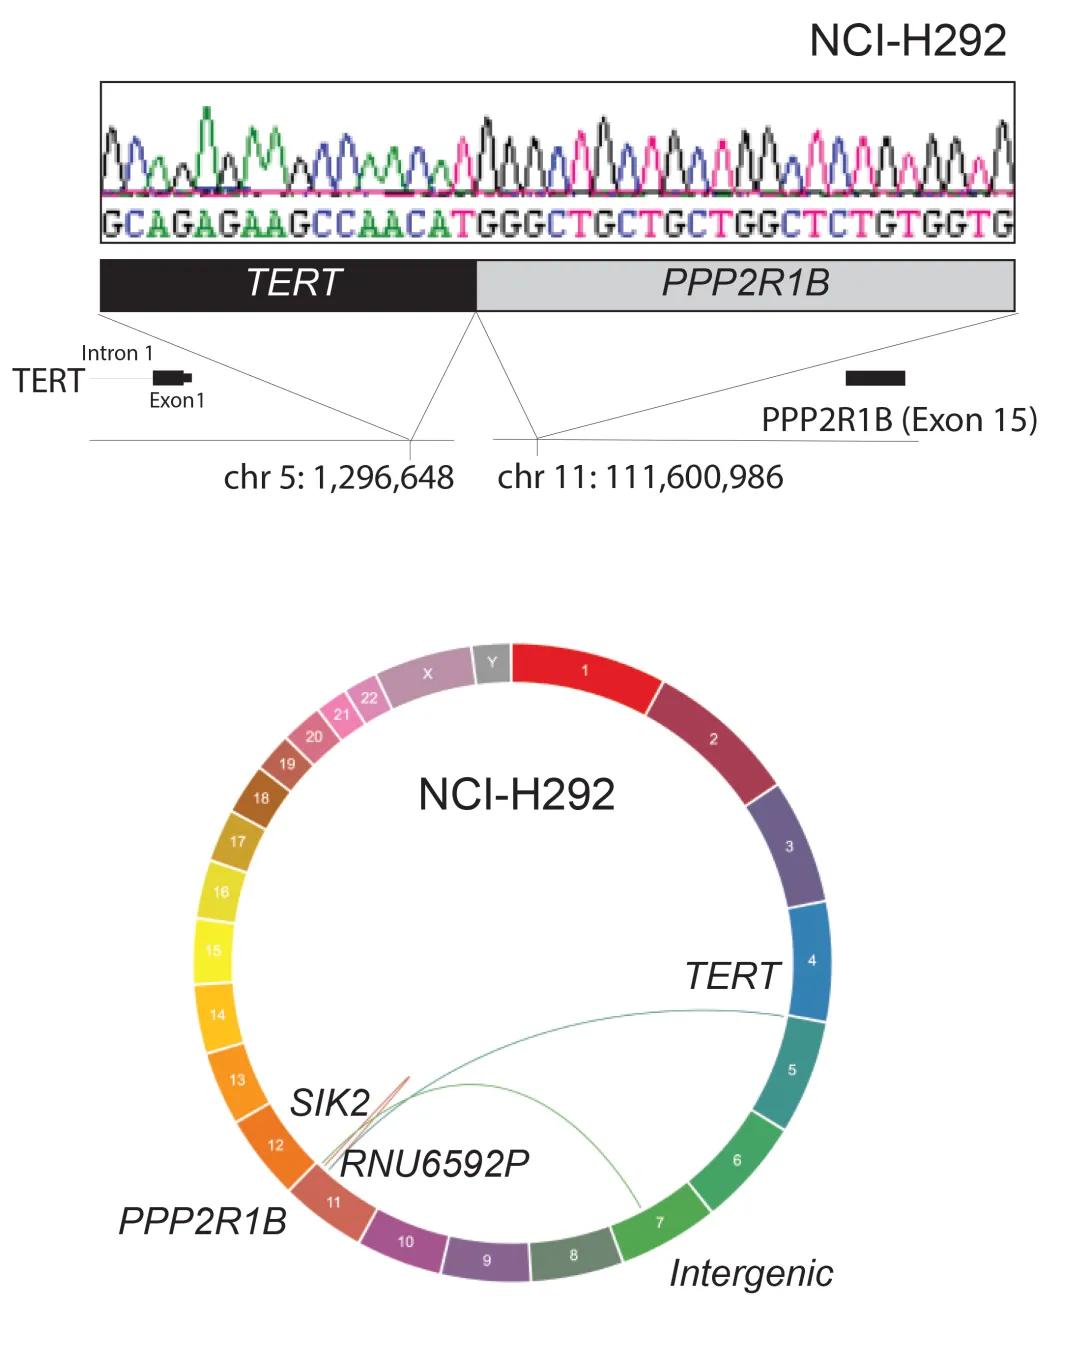
The figure shows a genetic rearrangement in the NCI-H292 cell line involving the TERT and PPP2R1B genes.
Top panel: A DNA sequencing trace with colored peaks (green, black, red, blue) shows the nucleotide sequence where the TERT gene joins the PPP2R1B gene. Below the trace, a schematic highlights the fusion: the TERT gene (black box) on chromosome 5 is connected to the PPP2R1B gene (gray box) on chromosome 11. Arrows indicate specific breakpoints—TERT intron 1 at chromosome position 5:1,296,648 and PPP2R1B exon 15 at chromosome position 11:111,600,986.
Bottom panel: A circular “ideogram” of all human chromosomes (1–22 plus X and Y) illustrates structural rearrangements. Chromosomes are arranged around the circle and color-coded. Curved lines inside the circle connect the involved loci: a link from chromosome 5 (TERT) to chromosome 11 (PPP2R1B) and additional labeled connections to SIK2, RNU6592P, and an intergenic region, indicating multiple genomic rearrangements.
Our study helped uncover how genetic changes drive the growth of a type of salivary gland cancer called Mucoepidermoid Carcinoma (MEC). We found new genetic information about the well-known CRTC1::MAML2 fusion and also discovered new rearrangements in a gene called TERT, which are very common and important in these tumors. These discoveries could lead to better ways to diagnose and treat MEC in the future.
Identification of predictive potential of mid-treatment biomarkers in HPV+ OPSCC
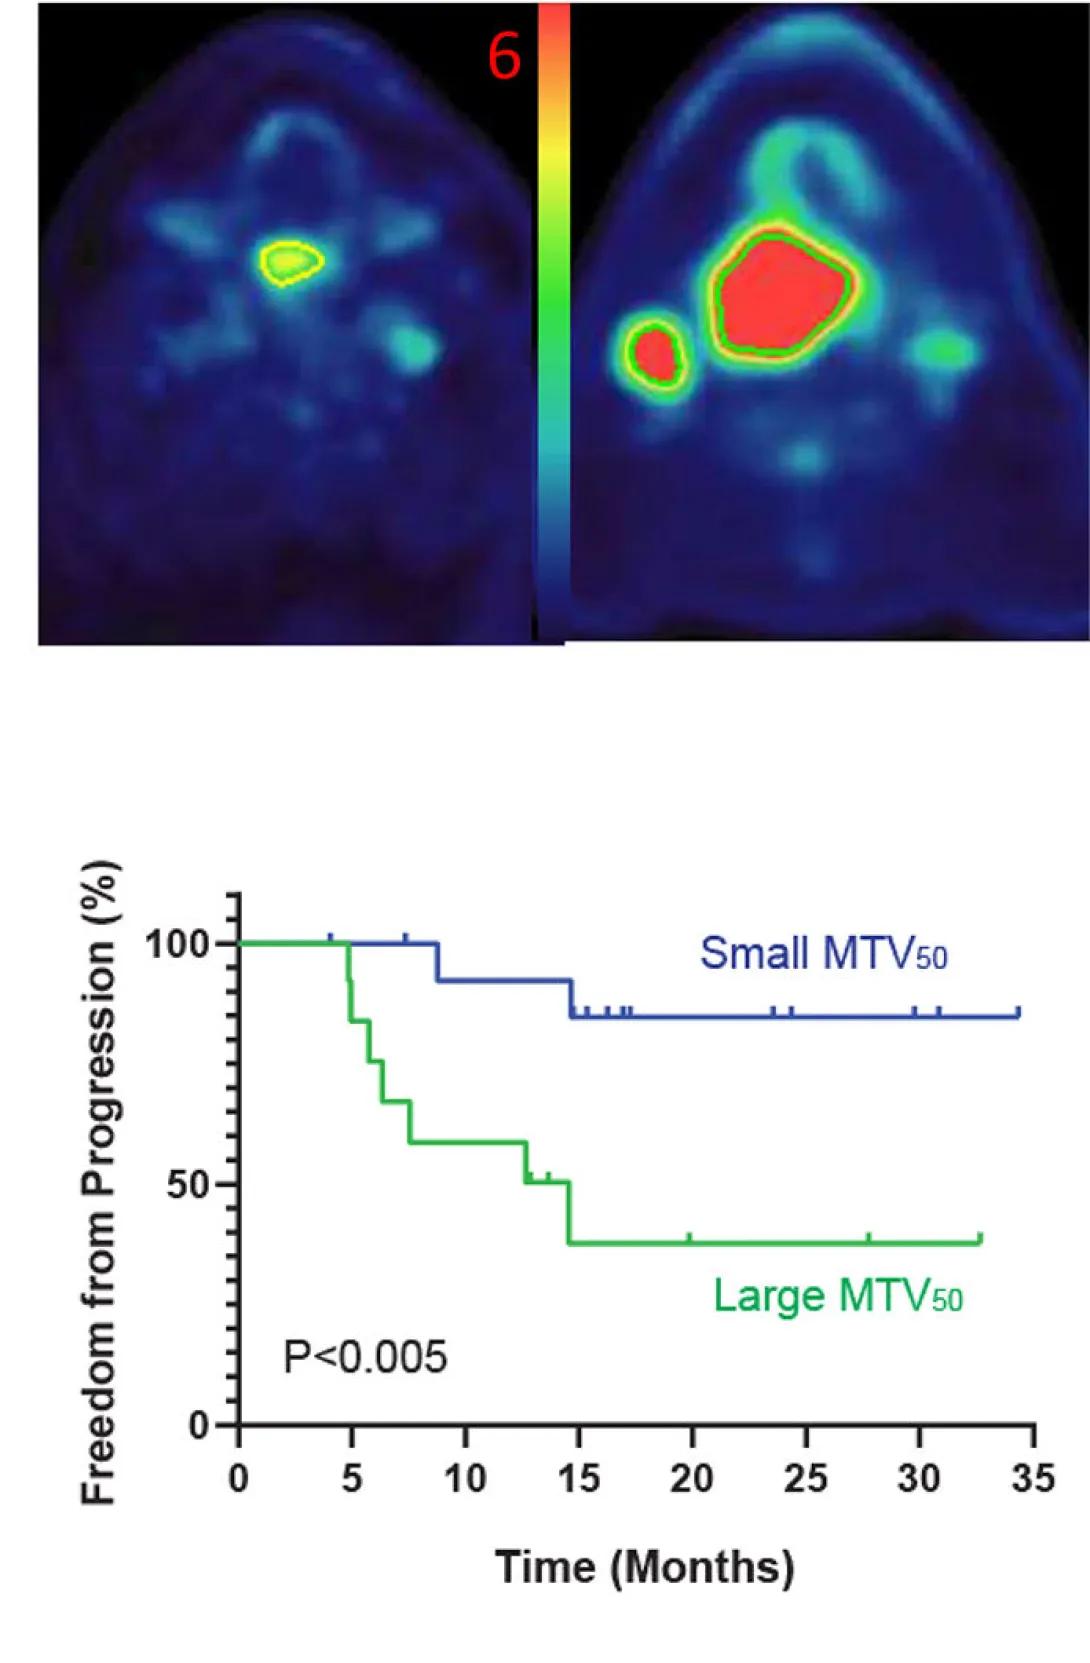
The figure shows imaging and survival data comparing patients with small versus large metabolic tumor volume (MTV₅₀).
Top panel: Two PET/CT scan slices of the head and neck illustrate different tumor sizes. The left image shows a small tumor area with low metabolic activity (yellow-green region on a blue background). The right image shows a much larger tumor region with higher activity, highlighted in bright red. A color scale bar between the images runs from blue (low uptake) through green and yellow to red (high uptake), with a “6” labeled at the top.
Bottom panel: A Kaplan–Meier survival curve displays “Freedom from Progression (%)” on the y-axis (0–100%) versus “Time (Months)” on the x-axis (0–35 months). Two lines compare outcomes:
Blue line: Patients with small MTV₅₀ maintain higher freedom from disease progression, remaining above about 80% throughout the 35 months.
Green line: Patients with large MTV₅₀ show a rapid decline, dropping below 50% by roughly 12 months and leveling near 30% after 20 months.
A note indicates P < 0.005, demonstrating a statistically significant difference in progression-free survival between the two groups.
In this study, we showed that measuring HPV tumor DNA in the blood or taking additional mid-treatment imaging during treatment could help predict how well patients with HPV+ Oropharyngeal cancer will respond to therapy. Specifically, lower circulating HPV ctDNA levels before treatment and a small increase during the second week were signs of better outcomes. These mid-treatment blood tests and scans worked well at identifying outcomes early, suggesting a simple blood test might one day help guide cancer care more effectively.
Discovery of predictive potential of mid-treatment biomarkers in HPV+ OPSCC
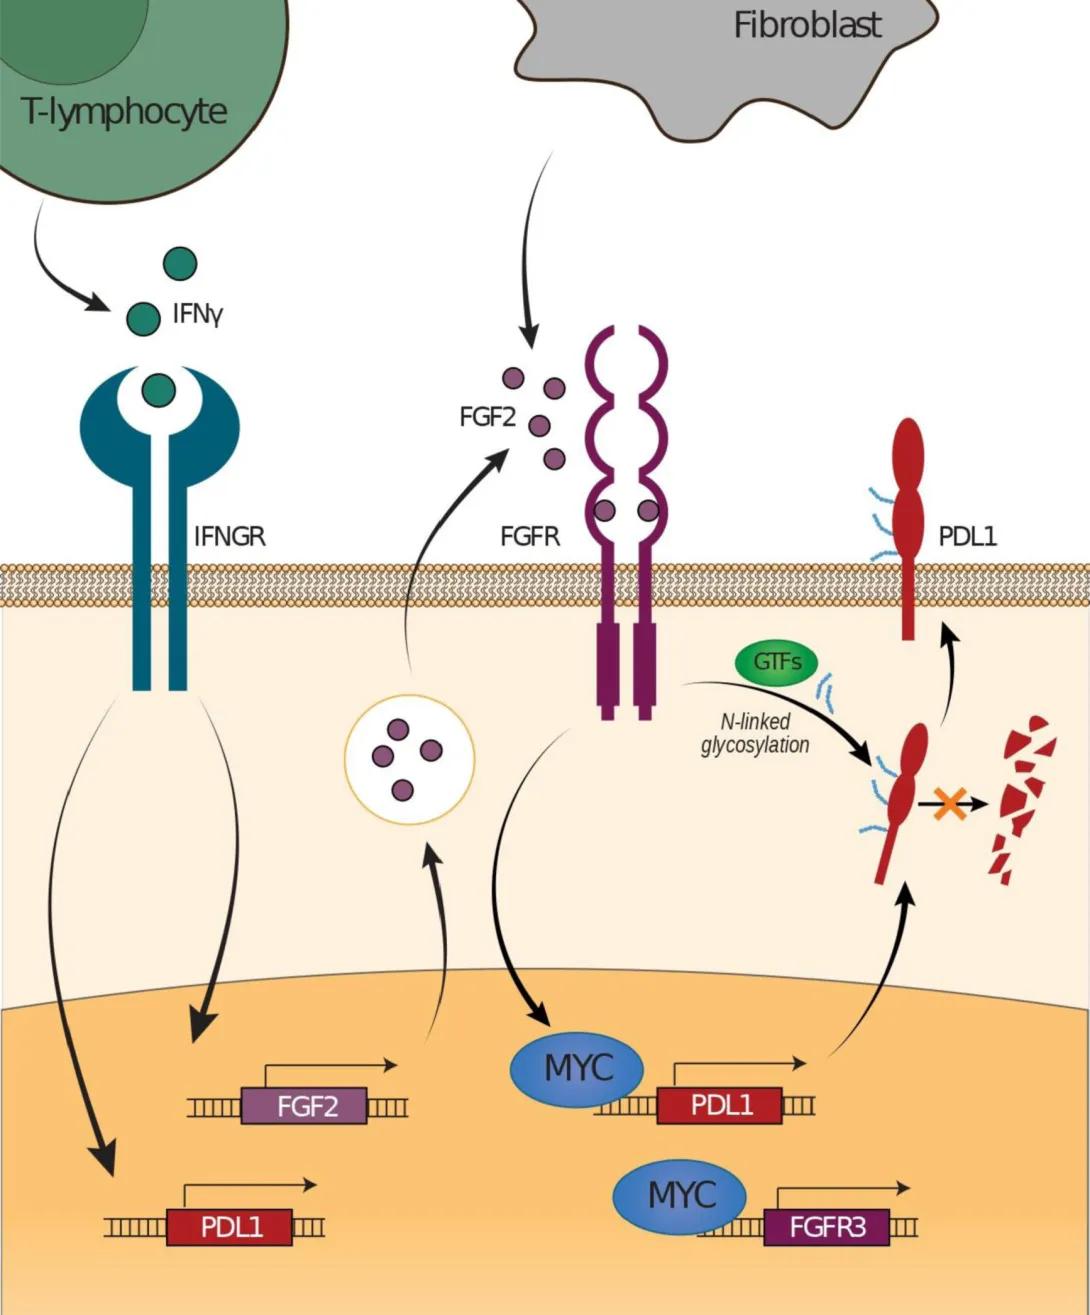
This illustration shows a proposed model of how fibroblast growth factor signaling regulates PD-L1 expression in tumor cells.
Left side: A green T-lymphocyte releases interferon gamma (IFNγ), which binds to its receptor (IFNGR) on the tumor cell surface. This signaling increases transcription of the PD-L1 gene inside the cell.
Center: A gray fibroblast secretes fibroblast growth factor 2 (FGF2). FGF2 binds to the fibroblast growth factor receptor (FGFR) on the tumor cell membrane. This activates signaling that increases expression of the transcription factor MYC, which in turn promotes transcription of PD-L1 and FGFR3 genes, amplifying the pathway.
Right side: PD-L1 protein is shown at the tumor cell surface, where it undergoes N-linked glycosylation (indicated by blue marks) facilitated by glycosyltransferases (GTFs). Glycosylated PD-L1 is stabilized and accumulates on the cell membrane.
Overall, the diagram depicts how IFNγ from immune cells and FGF2 from fibroblasts converge to enhance PD-L1 production and stability in tumor cells through MYC activation and glycosylation.
In our study, we discovered that a cell signaling pathway called FGF/FGFR can increase levels of a protein called PD-L1 in head and neck cancer cells, which helps the cancer hide from the immune system. By blocking this pathway, we were able to stop PD-L1 from going up—even in cases where it’s usually triggered by the immune system. These findings suggest that combining FGF/FGFR inhibitors with current immunotherapy could make treatment more effective for patients with head and neck cancer.
Circulating Tumor DNA has Promise for Early Detection of Recurrence in HPV+ Head and Neck Cancer
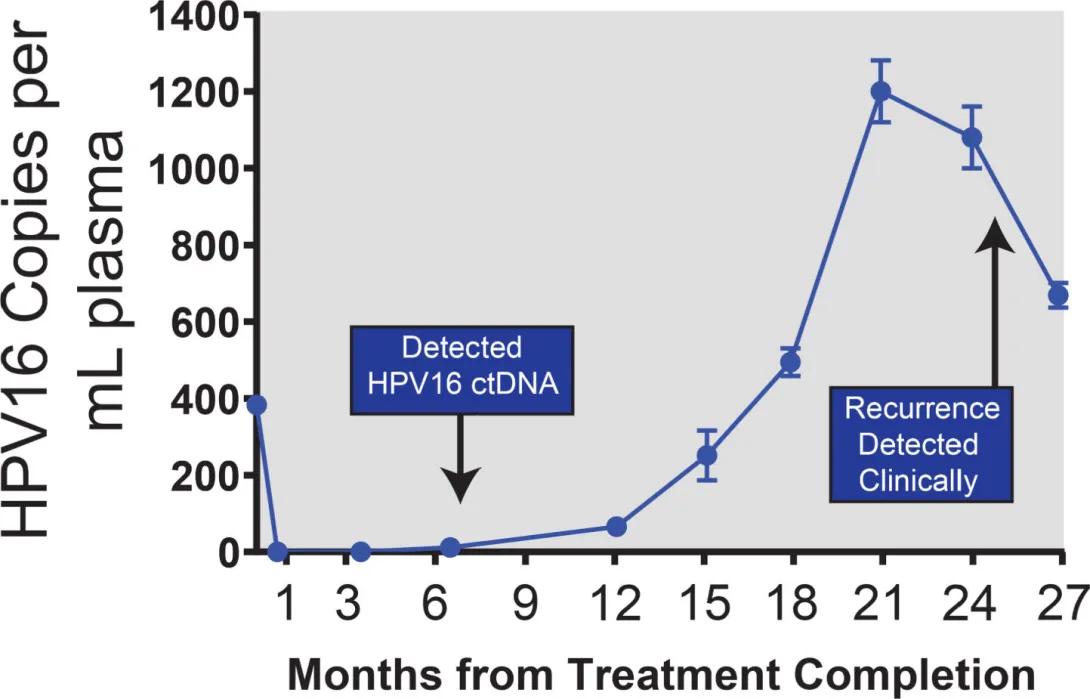
This graphic is a line chart showing how the number of HPV16 DNA copies in blood plasma changes over time after treatment.
Horizontal axis (x-axis): “Months from Treatment Completion,” starting at 0 and marked at 1, 3, 6, 9, 12, 15, 18, 21, 24, and 27 months.
Vertical axis (y-axis): “HPV16 Copies per mL plasma,” ranging from 0 to 1,400.
Data trend:
• At the start (month 0), the level is about 400 copies per mL.
• It quickly drops to nearly zero by month 1 and stays near zero through month 9.
• After month 9, the levels begin to rise slowly, then sharply climb between months 15 and 21, reaching a peak of around 1,200 copies per mL around month 21.
• After peaking, the levels decrease slightly by month 27 but remain elevated (around 600–800 copies per mL).
Callout boxes:
• At month 6, a label reads “Detected HPV16 ctDNA,” with an arrow pointing to a small rise in the line.
• At month 24, another label reads “Recurrence Detected Clinically,” indicating that clinical detection of cancer recurrence occurred several months after the rise in HPV16 DNA was first measurable.
Here we completed one of the first longitudinal studies following an HPV+ cancer patient who had completed therapy with HPV circulating tumor DNA testing in routine blood samples. This report identified biochemical recurrence of disease significantly prior to clinical recurrence and was some of the first evidence suggesting a potential future utility for ctDNA monitoring in HPV+ patients.
Advancement of new Clinical Testing Approaches to detect HPV+ Cancer from Blood
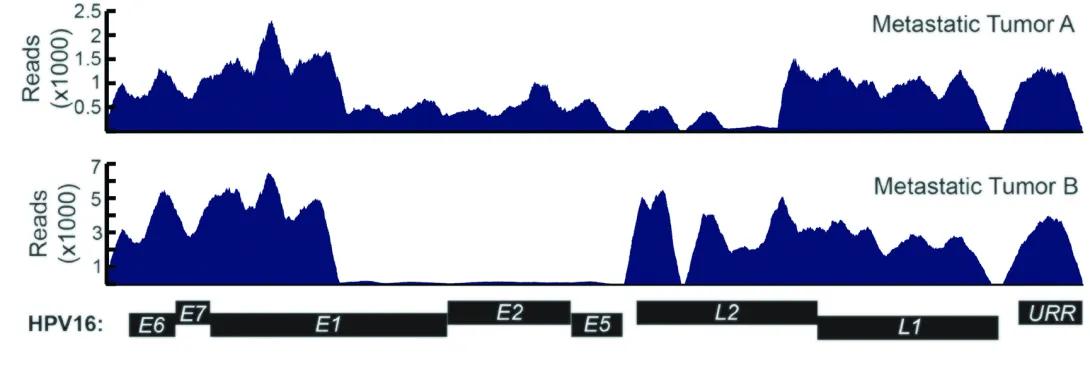
This image presents a comparison of viral gene expression across the HPV16 genome in two metastatic tumor samples—labeled Metastatic Tumor A and Metastatic Tumor B.
The graphic is composed of three main sections, vertically aligned:
Top Panel (Metastatic Tumor A):
A blue histogram shows sequencing read counts (expression levels) along the HPV16 genome.
The Y-axis is labeled "Reads (x1000)", ranging from 0 to 2.5.
The expression pattern is relatively uniform across much of the genome, with peaks in the regions corresponding to E6, E7, E1, and E2, and additional expression in L1 and L2.
Middle Panel (Metastatic Tumor B):
Another blue histogram, this time with the Y-axis going up to 7 (x1000) reads.
The expression pattern is different from Tumor A:
There is strong expression in the E6 and E7 regions.
Expression drops sharply after E7 and is nearly absent in the E1, E2, and E5 regions.
Expression reappears in the L2 and L1 regions.
Bottom Panel (HPV16 Genome Map):
A schematic map of the HPV16 genome is shown, labeling the viral genes in order:
E6, E7, E1, E2, E5, L2, L1, and URR (Upstream Regulatory Region).
Each gene is represented as a black box aligned horizontally with the read data above it.
Key Observations:
Metastatic Tumor A shows more even expression across the HPV genome.
Metastatic Tumor B shows strong expression of E6 and E7, which are oncogenes (cancer-promoting genes), with suppressed expression of E1/E2, which normally regulate viral replication and oncogene expression.
These patterns suggest differences in how the virus is acting in each tumor, possibly due to viral DNA integration or regulatory changes.
In this study, we developed a highly sensitive blood test to track tumor circulating tumor DNA in the blood of patients with metastatic HPV-related Oropharyngeal Cancer, based on the composition of the HPV genome found in tumors (shown in the image). We found that changes in this circulating tumor DNA could predict whether treatment is working in patients with metastatic cancer—often much earlier than traditional scans. This test could help doctors switch patients to better treatments sooner, giving them a better chance at improved outcomes.
Successful Development of New Software to Understand How HPV Causes Cancer
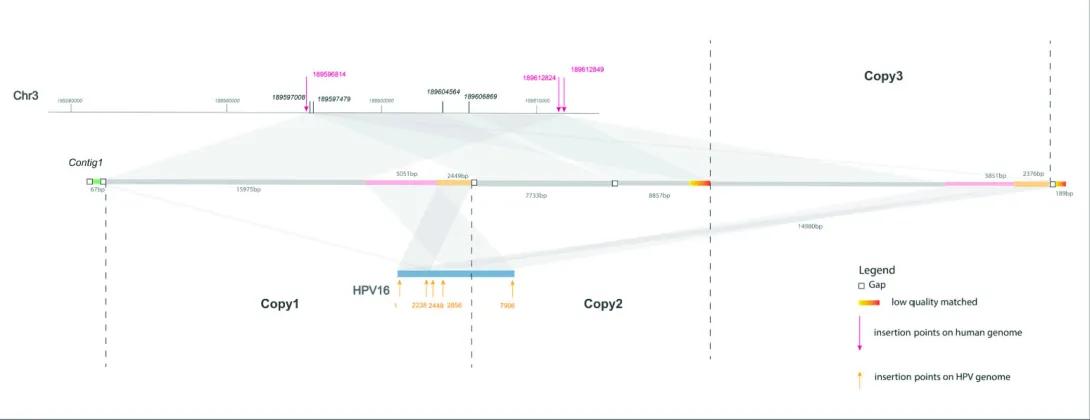
This graphic depicts how the HPV16 (Human Papillomavirus type 16) genome integrates into the human genome—specifically, into Chromosome 3 (Chr3). It shows multiple copies of viral DNA inserted at various points along a segment of human DNA, with connections illustrating where and how the insertions occur.
Sections of the Graphic:
Top Line – Human Chromosome 3 (Chr3):
A horizontal line at the top represents a region of Chromosome 3, with genomic positions labeled (e.g., 189597000, 189606000).
Several insertion points are marked along the chromosome with magenta arrows pointing down, labeled with genomic coordinates (e.g., 189598614).
These magenta arrows indicate insertion points where HPV DNA has integrated into the human genome.
Middle Line – Contig1 (Assembled Segment):
A line labeled Contig1 sits below Chr3 and represents an assembled sequence from genome sequencing that spans multiple regions of the chromosome and viral DNA.
The contig is segmented and annotated:
Gaps (white boxes)
Low-quality matched regions (colored red/orange)
Lengths of sequence segments are labeled in base pairs (e.g., 7733 bp).
Contig1 links regions of the chromosome with sections of HPV DNA.
Bottom – HPV16 and Viral Copies:
The HPV16 genome is shown in blue and labeled with coordinates along the viral genome (e.g., 2328, 2449, 2856, 7598).
There are three labeled regions below the contig:
Copy1
Copy2
Copy3
Each copy represents a distinct instance of HPV DNA integrated into the genome.
Orange arrows below HPV16 indicate the specific insertion points on the viral genome.
Connections and Alignment:
Gray-shaded ribbons connect regions between Chr3, Contig1, and HPV16. These represent alignment and integration events—how the viral genome is embedded into human DNA.
Some connections are duplicated, indicating multiple copies of the virus inserted at different locations.
Legend (Bottom Right):
Gap = sequence gap
Red/Orange = low-quality matched region
Magenta arrows = insertion points on human genome
Orange arrows = insertion points on HPV genome
In this study, we developed a new tool called SearcHPV to more accurately find where HPV inserts itself into human DNA—a key step in how the virus causes cancer. Our tool worked better than older methods and helped us discover important HPV integration sites near genes linked to cancer. This could lead to a better understanding of how HPV drives cancer and help researchers find new ways to diagnose or treat it.
Creation of Strategies to Improve Molecular Differentiation of Rare Salivary Tumors
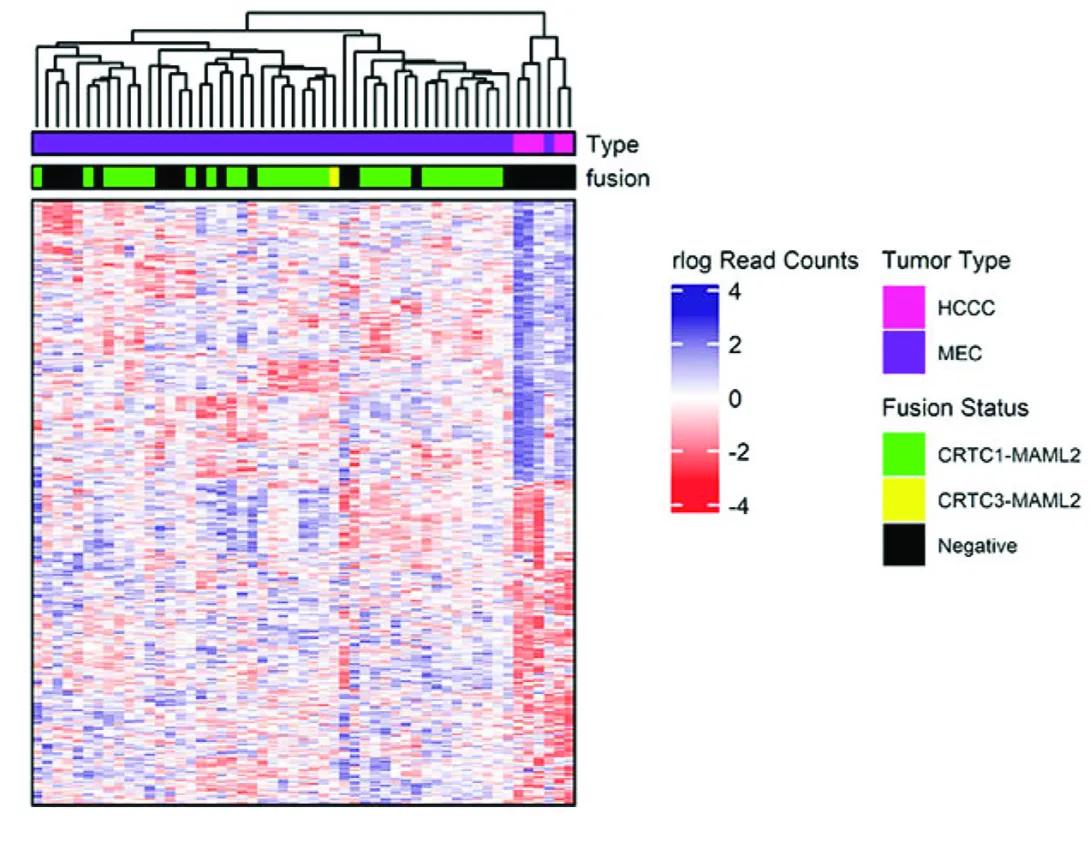
This image is a heatmap with hierarchical clustering used to visualize gene expression patterns in different tumor samples, with annotations indicating tumor type and gene fusion status.
1. Heatmap Structure
The main panel of the image is a color-coded grid (heatmap) showing gene expression data.
Each column represents a tumor sample.
Each row represents a gene.
The color of each cell represents the level of gene expression, based on the rlog (regularized log) read counts:
Blue: Higher expression (up to +4)
Red: Lower expression (down to -4)
White: Neutral expression (around 0)
2. Dendrogram (Top of Heatmap)
Above the heatmap is a dendrogram, which is a tree-like diagram showing hierarchical clustering of tumor samples based on their gene expression profiles.
This clustering groups similar tumors together.
3. Annotations (Top Colored Bars)
There are two horizontal bars above the heatmap columns, providing metadata for each sample:
a. Type (Tumor Type)
Colors represent tumor types:
Magenta = HCCC (Hyalinizing Clear Cell Carcinoma)
Purple = MEC (Mucoepidermoid Carcinoma)
b. Fusion (Gene Fusion Status)
Colors represent fusion types:
Green = CRTC1-MAML2 fusion
Yellow = CRTC3-MAML2 fusion
Black = Fusion-negative (no known fusion)
4. Legend (Right Side of Image)
The legend decodes the color schemes used in the top bars:
Tumor Type:
Magenta = HCCC
Purple = MEC
Fusion Status:
Green = CRTC1-MAML2
Yellow = CRTC3-MAML2
Black = Negative (no fusion detected)
Also shown is the color scale for the heatmap:
Blue (+4): high expression
Red (−4): low expression
White (0): baseline expression
Our lab completed the first full transcriptomic analysis of a rare salivary gland cancer called hyalinizing clear cell carcinoma (HCCC). We discovered a unique set of genes that can help differentiate this cancer from similar-looking tumors. The analysis also found changes in specific growth pathways that could lead to new treatment options.
Leveraging Drug Screens to Target Cetuximab Resistance
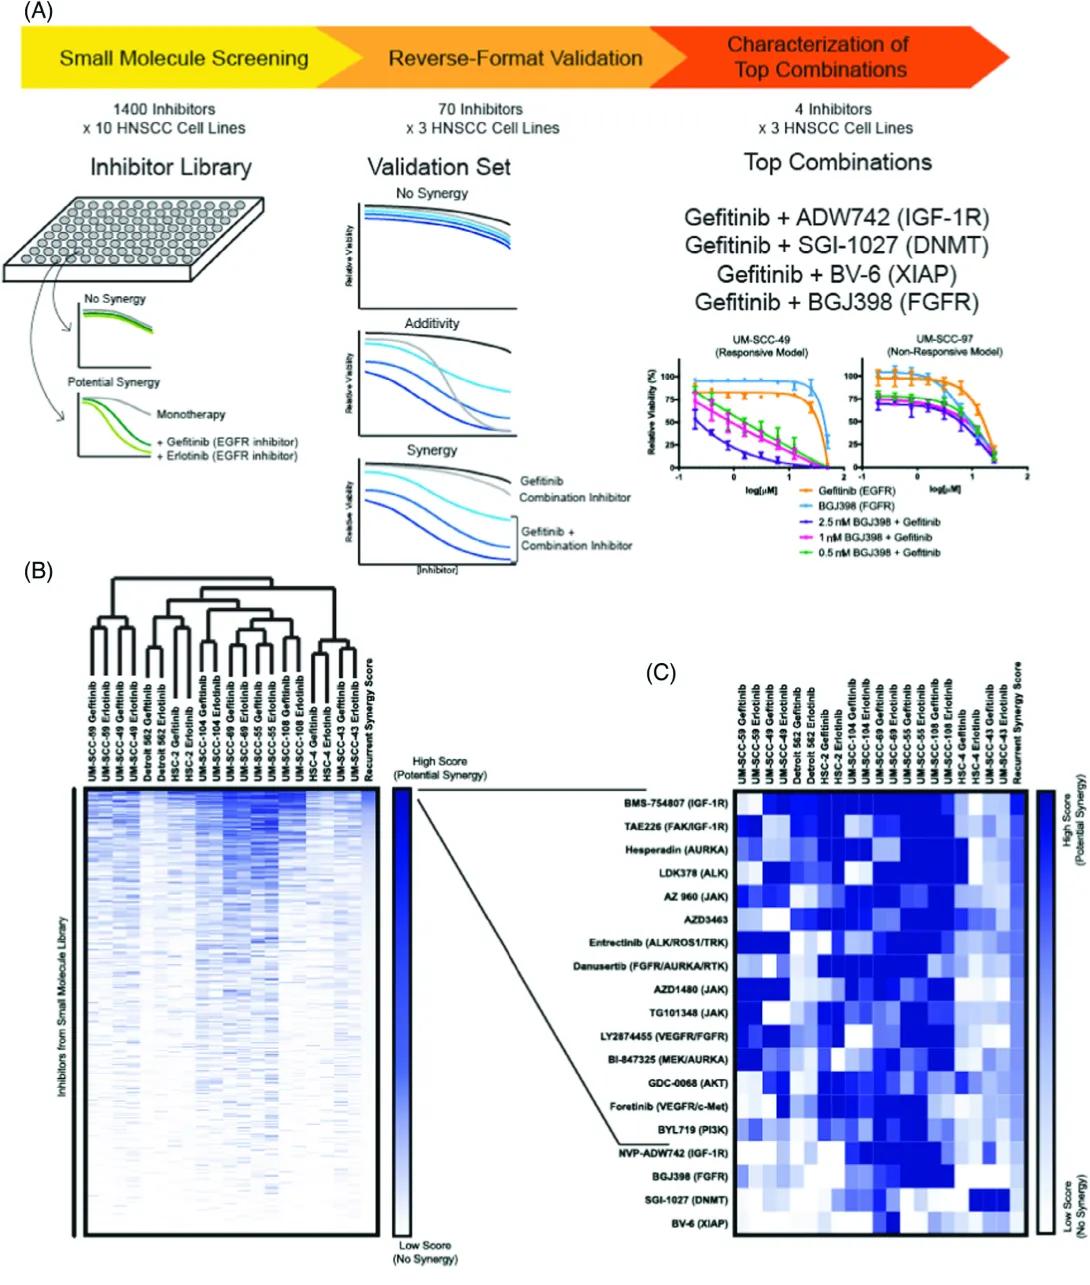
Title: Drug Screening and Validation Pipeline
Small Molecule Screening:
Library: 1400 inhibitors tested on 10 HNSCC cell lines.
Objective: Find compounds that show potential synergy with EGFR inhibitors (Gefitinib and Erlotinib).
Visual: A plate with wells represents the drug screening.
No Synergy: Green and black lines show no added effect from the combination.
Potential Synergy: A deeper inhibition curve suggests the drug combo is more effective than either alone.
Reverse-Format Validation:
Validation Set: 70 inhibitors tested in 3 HNSCC cell lines.
Result Types:
No Synergy: Combination isn’t more effective than single drugs.
Additivity: Combination equals the sum of effects.
Synergy: Combo works better than additive effect.
Characterization of Top Combinations:
Top 4 combinations with Gefitinib:
Gefitinib + ADW742 (IGF-1R inhibitor)
Gefitinib + SGI-1027 (DNMT inhibitor)
Gefitinib + BV-6 (XIAP inhibitor)
Gefitinib + BGJ398 (FGFR inhibitor)
Graphs:
Left (UM-SCC-49): Responsive cell line shows strong inhibition when Gefitinib is combined with BGJ398.
Right (UM-SCC-97): Non-responsive model shows weaker inhibition.
Panel B: Heatmap and Clustering of Synergy Scores
Title: Synergy Scores Across Cell Lines and Inhibitors
Heatmap:
Rows: Inhibitors from the small molecule library.
Columns: HNSCC cell lines treated with Gefitinib.
Color Gradient: Dark blue = high synergy score (strong potential synergy), white = low synergy score (no synergy).
Clustering: Cell lines are grouped based on similarity in response to inhibitors, forming a dendrogram at the top.
Scale Bar: Indicates high to low synergy scores.
Panel C: Zoom-In of Top Hits from Heatmap
Title: Top Synergistic Inhibitors with Gefitinib
List of Top Inhibitors: Focuses on ~20 inhibitors showing strongest synergy (from Panel B).
Pathways Targeted: Includes IGF-1R, FGFR, DNMT, JAK, PI3K, ALK, etc.
Heatmap (Right):
Rows: Individual inhibitors.
Columns: HNSCC cell lines.
Color Intensity: Blue indicates strength of synergy score.
Shows variability in response across different cell lines.
In this study, we looked for new drug combinations that could help treat head and neck cancer when common treatments like EGFR inhibitors, like Cetuximab, only work modestly well on their own. We found some promising combinations—including both known and newly discovered ones—that worked better together than alone in killing cancer cells. These findings could lead to more personalized and effective treatments in the future.
Genetic Characterization of commonly used Oral Cavity Cell Lines
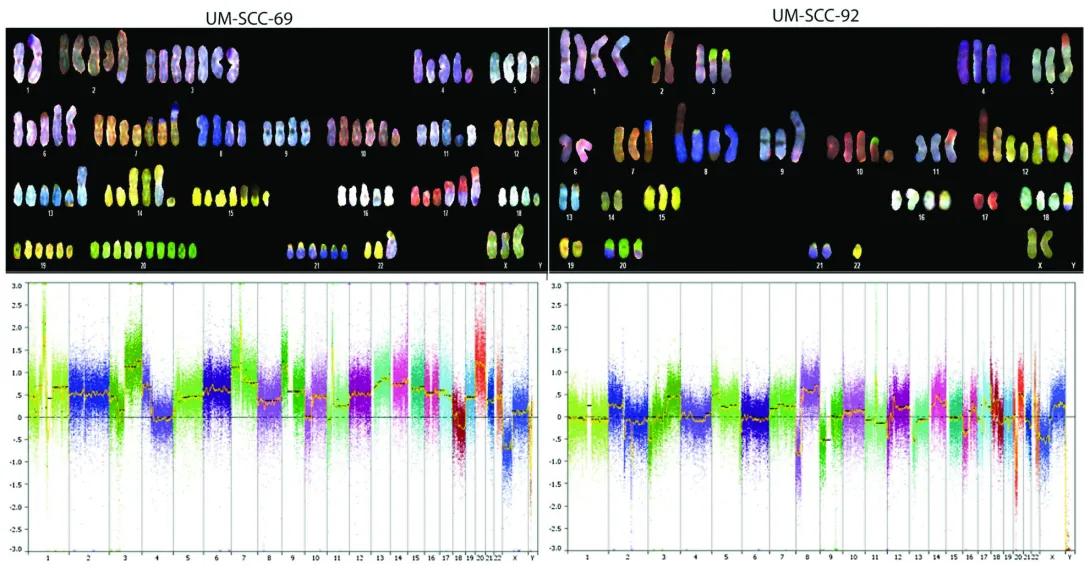
Upper Panels – Spectral Karyotyping (SKY)
Each upper section shows a spectral karyotype of the cancer cell line:
UM-SCC-69 (Left) and UM-SCC-92 (Right).
Chromosomes are artificially colored using a technique that gives each chromosome pair a unique spectral signature.
This technique highlights chromosomal abnormalities such as:
Missing chromosomes.
Extra chromosomes.
Rearrangements (like translocations or fusions).
Structural changes (like duplications or deletions).
Observations:
Both cell lines show significant chromosomal abnormalities, typical of cancer cells.
The number of chromosomes and their appearances differ from normal human cells.
Lower Panels – Copy Number Variation (CNV) Analysis
The bottom graphs show copy number changes across the genome:
X-axis: Chromosome numbers from 1 to 22, and X/Y.
Y-axis: Log2 ratio of DNA copy number changes (range: -3.0 to +3.0).
0 on the Y-axis indicates normal copy number.
Above 0: Gains/amplifications of DNA regions.
Below 0: Losses/deletions of DNA regions.
Colored dots represent data points across the genome, color-coded by chromosome.
An orange/yellow trend line shows the average copy number change for each chromosome.
Observations:
UM-SCC-69 (Left): Shows a mix of DNA gains and losses across many chromosomes.
UM-SCC-92 (Right): Also has widespread gains/losses but with a different pattern from UM-SCC-69.
These differences in copy number profiles help identify which genetic changes are associated with each cancer type.
Our lab characterized the detailed genetic makeup of 14 widely used oral cancer cell lines that had never been fully studied before. We found that these cell lines carry many of the same complex genetic changes seen in real patients, making them valuable tools for future cancer research. This work gives scientists a genetic map of the models used to study oral cancer.
Molecular Characterization of commonly used Laryngeal Cell Lines
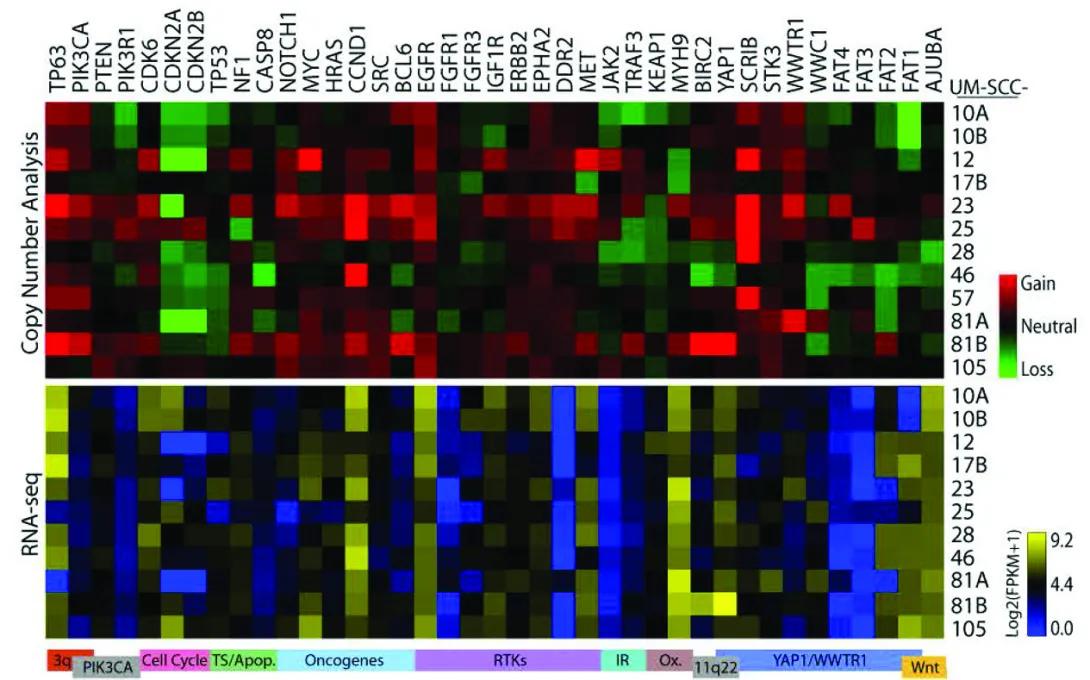
The figure contains two stacked heatmaps showing genetic changes across different cell lines of UM-SCC (head and neck cancer) samples.
Columns: Each column across the top lists a specific gene (from TP63 on the left to AURKA on the right).
Rows: Each row represents a UM-SCC cell line sample, labeled on the right side (10A, 10B, 12, 17B, 23, 25, 28, 46, 57, 81A, 81B, 105).
Top Panel – “Copy Number Analysis”
Purpose: Shows whether each gene has extra copies (gains), normal copies, or missing copies (losses) in each cell line.
Color meaning:
Red: Gain of gene copies.
Black/neutral: No change (normal number of copies).
Green: Loss of gene copies.
Pattern:
Some genes such as TP63 and PIK3CA show many red squares, meaning frequent gains across samples. Other genes, like CDKN2A and FAT family genes, show green squares, indicating frequent losses.
Bottom Panel – “RNA-seq”
Purpose: Shows gene activity (expression levels) for the same genes and cell lines.
Color meaning:
Yellow: High gene expression.
Black: Medium expression.
Blue: Low gene expression.
The color scale bar on the right ranges from dark blue (low) through black (medium) to bright yellow (high), labeled as log2(FPKM+1) values.
Pattern:
Expression levels vary widely. Some genes with copy number gains (red above) also show high expression (yellow below), suggesting those gains lead to more RNA production.
Our lab studied a panel of cancer cell lines derived from laryngeal tumors to better understand the genetic changes that drive this disease. We found that these cell lines reflect the same complex patterns seen in actual patients, making them powerful tools for testing new treatments. This work will help researchers choose the best models for developing more personalized and effective therapies.
Genotyping Resource for HNSCC cell line models
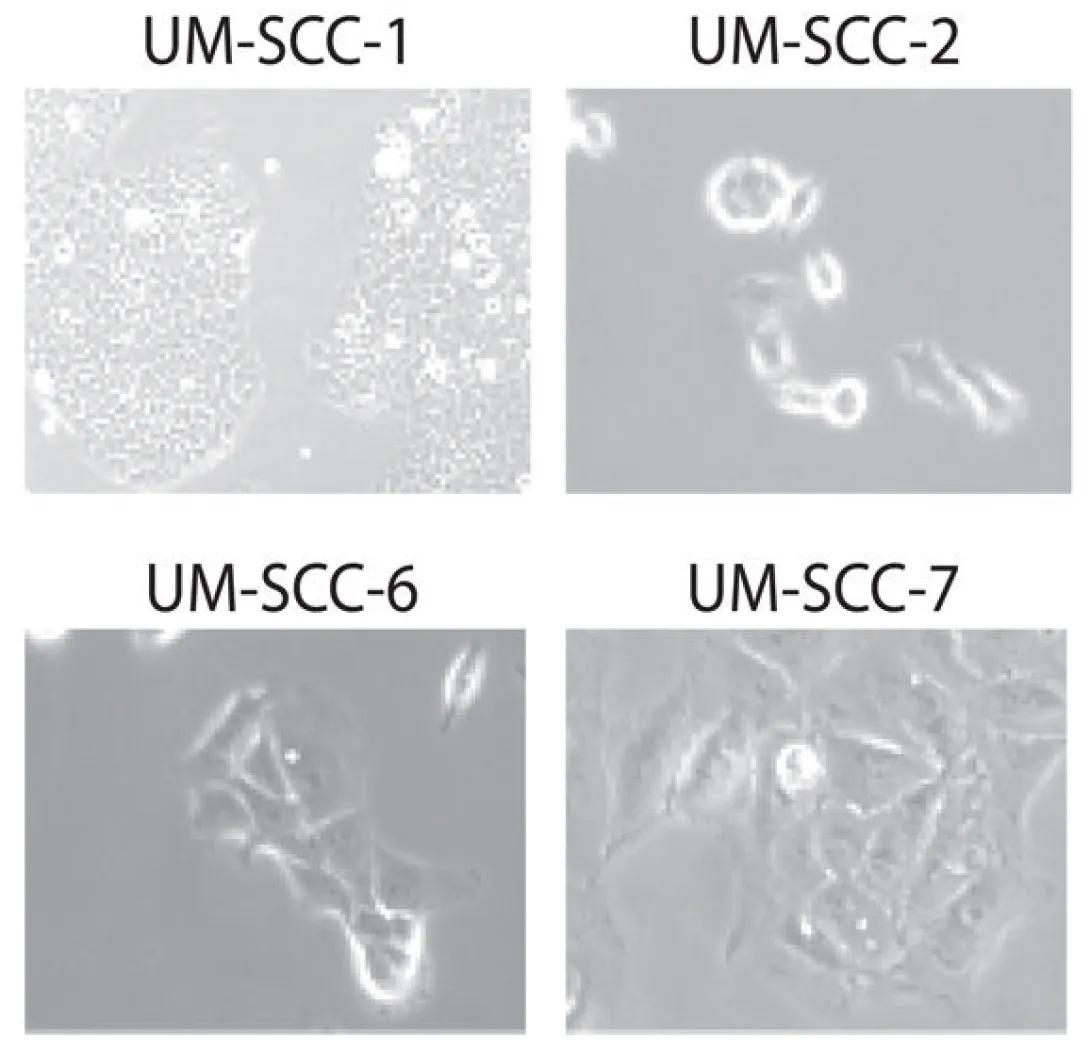
There are four square panels, arranged in a 2x2 grid. Each panel is labeled at the top with the name of the corresponding cell line:
Top Left: UM-SCC-1
Dense clusters of rounded cells.
Cells appear tightly packed and relatively small.
Suggestive of an epithelial-like morphology, common in carcinoma cell lines.
Top Right: UM-SCC-2
Fewer cells, more spaced apart.
Cells are more rounded or circular, with some having a ring-like appearance.
This could indicate a more suspended or less adherent cell growth pattern.
Bottom Left: UM-SCC-6
Elongated, spindle-shaped cells with pointed ends.
Cells appear stretched and more mesenchymal in appearance.
Suggests possible epithelial-to-mesenchymal transition (EMT) or different growth behavior.
Bottom Right: UM-SCC-7
Irregular cell shapes with a mix of elongated and spread-out morphologies.
More cellular interaction and spreading compared to UM-SCC-2 or UM-SCC-6.
Indicates a hybrid or variable morphology among the cells.
More Than 350 Citations
In my first HNSCC publication, from my time as an undergraduate, I confirmed the genetic identity of over 70 head and neck cancer cell lines developed at the University of Michigan. This ensures that researchers using these cells can easily verify that they are working with the correct models, which is important for reliable and reproducible results across the field.