Activity Dependent Plasticity

Activity dependent plasticity allows the central auditory system to adjust, react and adapt to changes in inputs
When working properly, activity dependent plasticity provides enhanced processing and allows for “active listening,” a focus on salient input and suppression of other channels. However, extremes of activity, such as deafness and noise, can overwhelm the mechanisms of activity dependent plasticity and cause unwanted changes. These changes lead to tinnitus and central auditory processing disorders.
The Altschuler Laboratory studies the mechanisms of central auditory plasticity, the changes that occur following the extremes of deafness or noise and their correlation with tinnitus and central auditory processing disorders. We find that the changes resulting from either noise or deafness upset the delicate balance between excitation and inhibition. This can lead to regions of increased excitability that may be associated with tinnitus, as well as regions of decreased excitability.
The lab's studies focus on changes in excitatory synaptic strength (the excitatory transmitter glutamate and its receptors), changers in inhibitory synaptic strength (the inhibitory transmitters GABA and glycine and their receptors) as well as changes in the ion channels that regulation neuronal excitability, such as the 2-pore domain potassium channels. Examples of results are shown below and are also available in our manuscripts.
Gene Chips
Affymetrix Gene Chips were screened for multiple deafness-related changes in gene expression. Out of the total of 8,799 probe sets, 1,400 showed differential expression.
Deafness Causes Decreases in the Inhibitory Transmitter Glycine
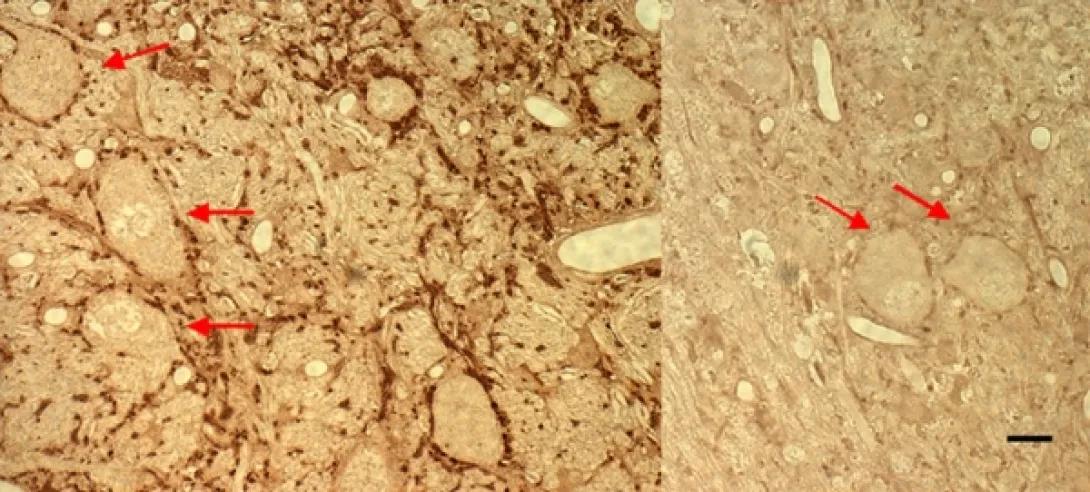
Microscopic image showing a side-by-side comparison of two brainstem tissue sections stained for neuronal structures.
• Left panel: Tissue section with dense, dark brown staining indicating high levels of immunoreactive signal (e.g., for a neurotransmitter or synaptic protein). Several large neuronal cell bodies are clearly outlined and marked with red arrows, highlighting positive labeling in and around the soma.
• Right panel: Similar tissue region with much lighter staining, indicating reduced immunoreactivity. Fewer dark-stained fibers or terminals are visible. Two neuronal cell bodies are indicated with red arrows, but they appear less intensely stained compared to the left panel.
• The image likely illustrates a comparison between control and experimental conditions, such as wild-type vs. knockout or untreated vs. treated, to show differences in neurotransmitter expression or synaptic density.
• A small black scale bar is present in the bottom right corner for reference.
This image may be used to demonstrate altered neurotransmitter or synaptic protein expression in brainstem auditory nuclei under different experimental conditions.
Photomicrograph comparing glycine immunostaining in the cochlear nucleus of a normal hearing versus a 2 week deafened rat
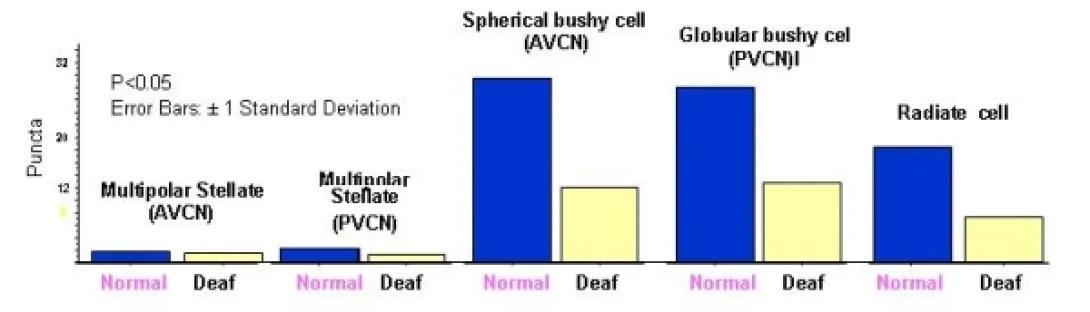
Bar graph comparing the number of synaptic puncta across five types of cochlear nucleus neurons in normal-hearing and deaf conditions.
• Y-axis: Labeled “Puncta,” representing synaptic contact points, with a range up to 52.
• X-axis: Lists five neuron types:
1. Multipolar Stellate (AVCN)
2. Multipolar Stellate (PVCN)
3. Spherical Bushy Cell (AVCN)
4. Globular Bushy Cell (PVCN)
5. Radiate Cell
• For each neuron type, two bars are shown:
• Blue bar: Normal-hearing
• Yellow bar: Deaf
Key observations:
• Spherical and globular bushy cells show a significant reduction in synaptic puncta in deaf animals compared to normal (P < 0.05).
• Multipolar stellate cells show minimal change between normal and deaf.
• Radiate cells also show a noticeable reduction in puncta in deaf animals.
Text notes:
• P < 0.05
• Error bars represent ±1 standard deviation
This figure demonstrates that auditory deprivation reduces synaptic input, particularly in bushy and radiate cells, suggesting cell-type-specific vulnerability to hearing loss.
Deafness Causes Changes in Receptors for the Excitatory Transmitter Glutamate
Quantitative real-time PCR comparing glutamate receptor subunit expression in the rat cochlear nucleus in normal hearing (dark bar) versus 3 weeks deafened (light bar) animals
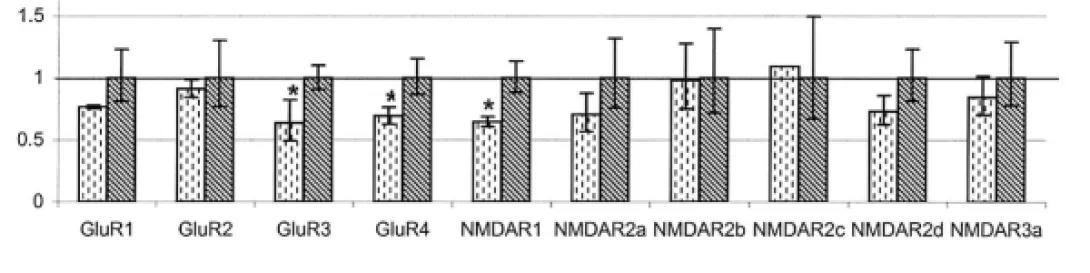
Bar graph showing relative expression levels of various glutamate receptor subunits (GluR1–4, NMDAR1, NMDAR2a–d, NMDAR3a). Each receptor has bars representing different groups or conditions (patterned, light and dark gray). The y-axis ranges from 0 to 1.5, with a baseline at 1.0. GluR3, GluR4, and NMDAR2c show significantly reduced expression (indicated by asterisks). Error bars represent standard deviations.
Deafness Causes Changes in Ion Channels
Figure showing decreased expression in the rat inferior colliculus of 2-pore domain potassium subunits at 3 days, 3 weeks and 3 months following deafness
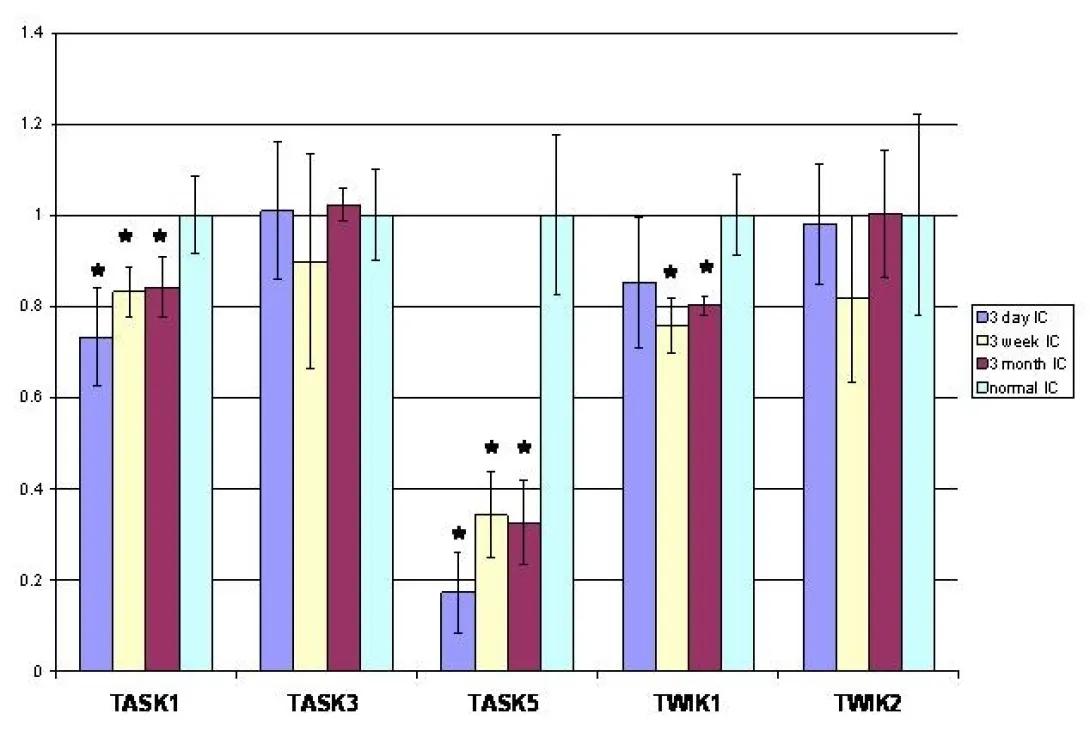
Bar graph showing expression levels of potassium channel genes (TASK1, TASK3, TASK5, TWIK1, TWIK2) across four experimental conditions: 3-day IC (blue), 3-week IC (yellow), 3-month IC (maroon), and normal IC (aqua). Y-axis ranges from 0 to 1.4. TASK1, TASK5, and TWIK1 show significantly reduced expression in some IC groups compared to normal IC, indicated by asterisks. Error bars represent standard deviations.