
Research | fMRI Lab
Research Overview
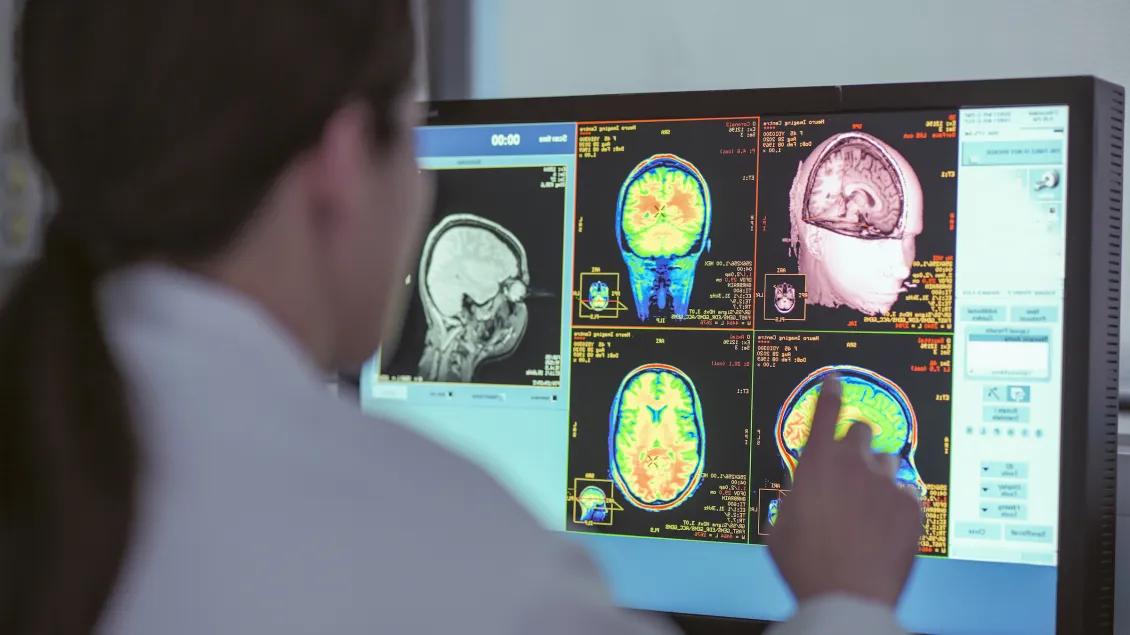
Our laboratory focuses on mapping human brain function using Magnetic Resonance Imaging (MRI), known as Functional MRI (fMRI), and other technologies, such as near-Infrared Spectroscopy (NIRS) and Transcranial Magnetic Stimulation (TMS). In fMRI, we develop technology to improve acquisition, making it faster, more quantitative, and less prone to distortion. We also seek to understand and model physiological changes (cerebral metabolism, blood flow, volume, or oxygenation) in response to task activation, so that the signals we detect can be appropriately calibrated. Lastly, we seek to apply our technology to new application domains in collaboration with basic and clinical neuroscientists across campus.
Research Topics of Lab Faculty
Arterial Spin Labeling
Arterial Spin Labeling (ASL) allows us to acquire quantitative images of brain perfusion without injecting contrast agents. Instead, the blood is magnetically labeled upstream from the tissue of interest before acquiring MR images. At the fMRI laboratory, we are developing new techniques to improve the quality of ASL images. Our aim is to use ASL as a quantitative alternative for functional imaging. We are developing new pulse sequences to improve the ASL signal, and new processing strategies for ASL-based functional MRI data in order to reduce noise, and detect and quantify brain activity.
Researcher: Luis Hernandez-Garcia
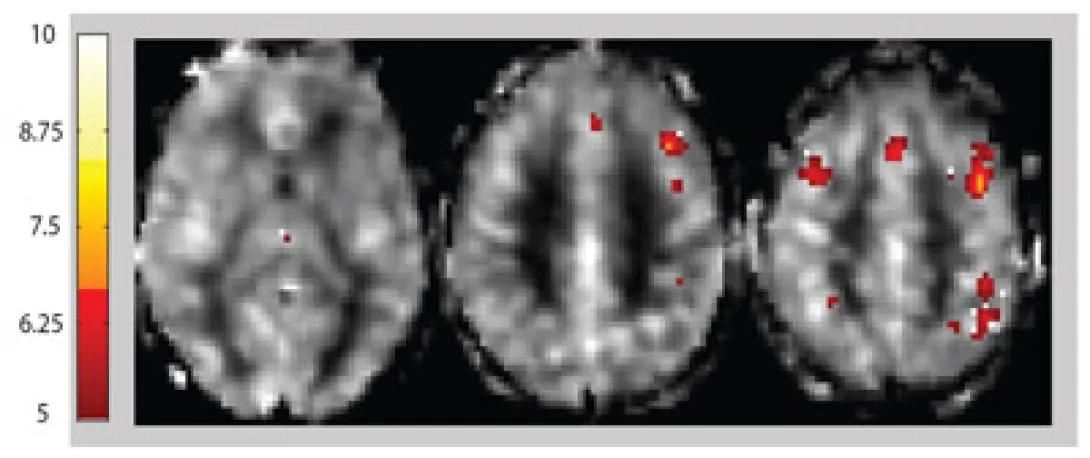
Quantitative images depicting the perfusion changes produced by two weeks of training on the cerebral activation pattern during a working memory task. The changes are overlaid on a map of the resting perfusion. The data are expressed in units of ml/min/100g of tissue.
Three axial brain MRI slices are displayed side by side, with red and yellow activation clusters overlaid, indicating areas of significant signal change. A vertical color bar on the left ranges from red at lower values to yellow at higher values, labeled approximately from 5 to 10, representing statistical intensity or activation strength.
Parallel Excitation
Two parts of every MRI acquisition are excitation and reception. One new technology being pursued is parallel excitation, in which multiple independent channels are used to rapidly excite customized patterns (the standard procedure uses a single excitation channel) for:
- Selection of specific regions of the body to allow for a more focused imaging study,
- Correction of intensity variations across the images,
- Correction of magnetic field inhomogeneities by pre-encoding specific compensation patterns to reduce distortions in fMRI.
Our group focuses on excitation pulse design (signal processing), system integration, and applications of parallel excitation.
Researchers: Douglas Noll and Jon-Fredrik Nielsen
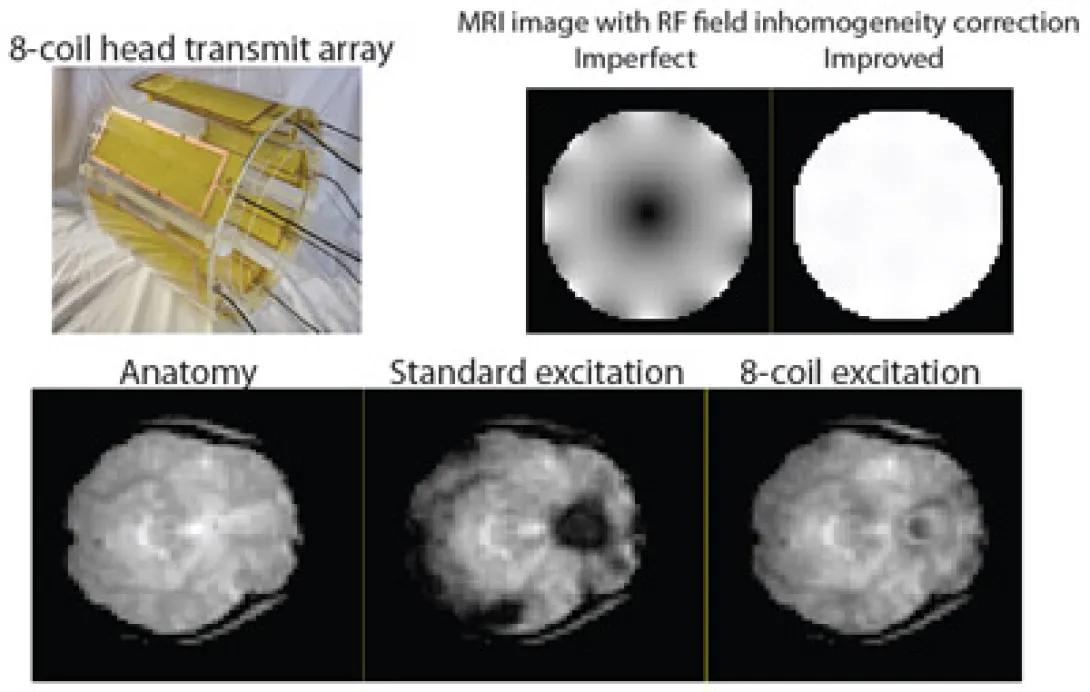
Main field inhomogeneity correction for functional MRI with parallel excitation.
Figure illustrating MRI RF field inhomogeneity correction using an 8-coil head transmit array. Top left shows a photograph of the yellow multi-coil head transmit device. Top right compares two circular MRI phantom images labeled “Imperfect” and “Improved,” demonstrating uneven versus uniform signal intensity after correction. Bottom row shows three axial brain images labeled “Anatomy,” “Standard excitation,” and “8-coil excitation,” with the standard excitation image displaying signal dropouts and shading artifacts that are reduced in the 8-coil excitation image. Caption notes main field inhomogeneity correction for functional MRI with parallel excitation.
Reconstruction Methods
In MRI, ideal image reconstruction uses a simple Fourier transform. However, there are a number of cases where this approach does not work well. For example, when magnetic field variations distort the simple Fourier relationship leading to image distortion, and in parallel imaging, where multiple independent channels are acquired using reduced sampling. Our lab, in collaboration with Prof. Fessler (EECS & BME), develops new image reconstruction algorithms that use statistical estimation approaches and models of the MRI physics to produce more stable and artifact-free images as well as estimates of physically and physiologically relevant parameters.
Researchers: Douglas Noll and Jon-Fredrik Nielsen
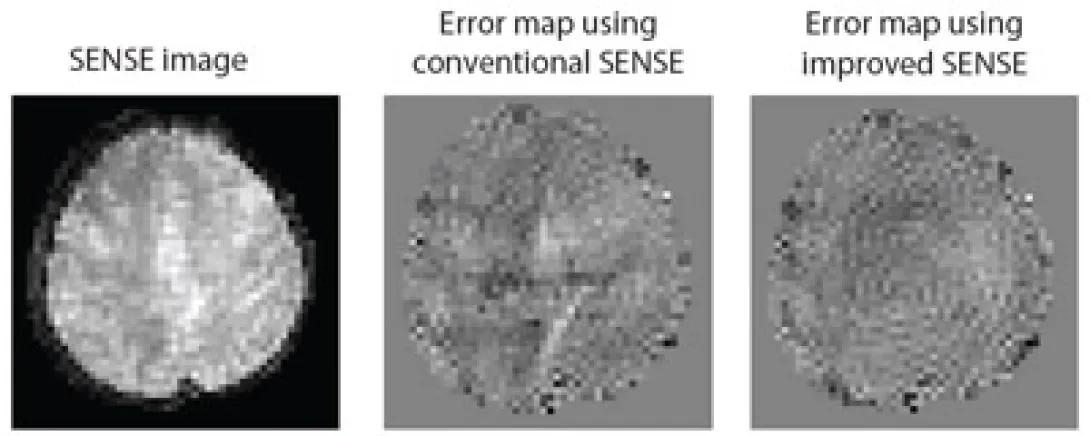
SENSE image and error maps showing reduction of aliasing artifact when using an improved SENSE with a new regularization method.
Three side-by-side grayscale brain images labeled “SENSE image,” “Error map using conventional SENSE,” and “Error map using improved SENSE.” The left image shows an axial brain MRI reconstructed with SENSE. The middle error map displays prominent aliasing and structured artifacts across the brain. The right error map shows a more uniform, reduced-artifact pattern, indicating improved reconstruction with a new regularization method. A caption notes the reduction of aliasing artifacts with the improved SENSE approach.
Real-time fMRI
Conventional functional MRI collects the BOLD-sensitive MR images of a subject performing a cognitive task, with subsequent image reconstruction and analysis performed offline. Recent advances in fMRI processing allow real-time applications (within same scan, with minimal lag): online data quality control, real-time functional activation monitoring, and interactive paradigms based on the subjects dynamic functional activity. At the fMRI laboratory, we are developing pattern classification techniques to investigate their use in real-time fMRI neurofeedback to modulate craving.
Researchers: Scott Peltier and Luis Hernandez-Garcia
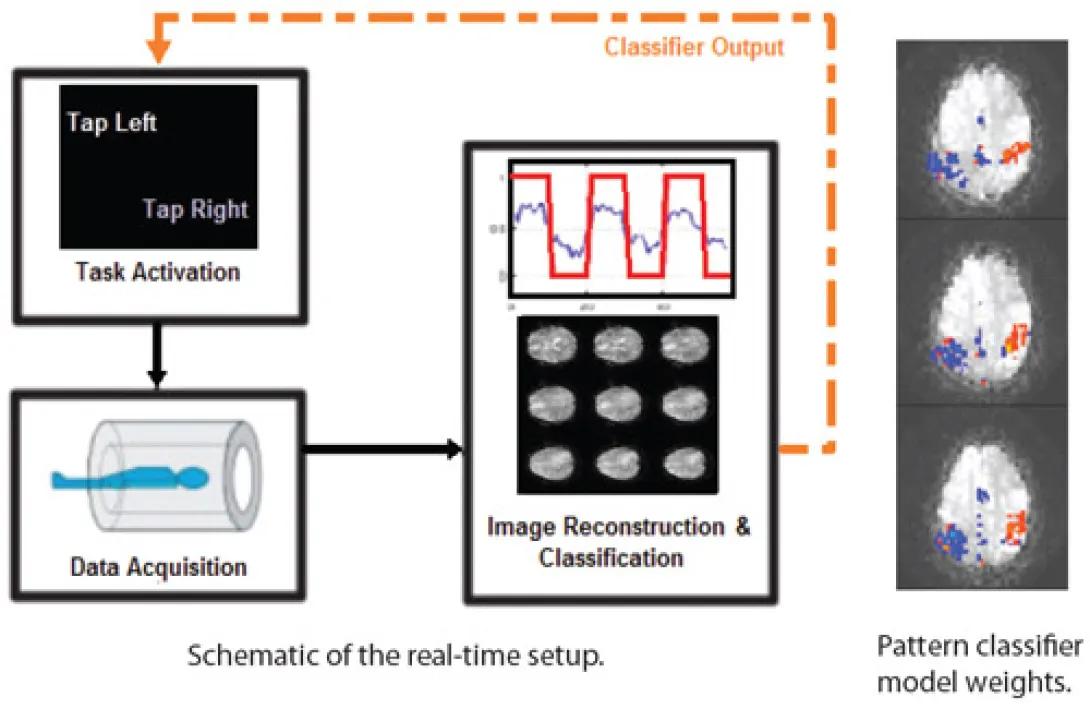
Diagram illustrating a real-time fMRI pattern classification workflow.
On the left, a “Task Activation” box shows instructions to tap left or right, which feed into “Data Acquisition,” showing a person lying inside an MRI scanner.
Data flow arrows lead to “Image Reconstruction & Classification,” which displays a time-series plot and multiple brain slice images.
A dashed arrow labeled “Classifier Output” points to the right, where three axial brain images show colored regions in red and blue representing pattern classifier model weights.
Caption reads, “Schematic of the real-time setup,” and “Pattern classifier model weights.”
Functional Connectivity
Recent fMRI have shown slowly varying timecourse fluctuations that are temporally correlated between functionally related areas (e.g. motor, visual, attentional networks), even at rest. Further studies have demonstrated altered connectivity for various neurological states. Thus, functional connectivity is potentially important as an indicator of regular neuronal activity. Our current work involves investigating and characterizing these functional connectivity patterns in control and patient groups, including detection using model-free analysis methods.
Researcher: Scott Peltier
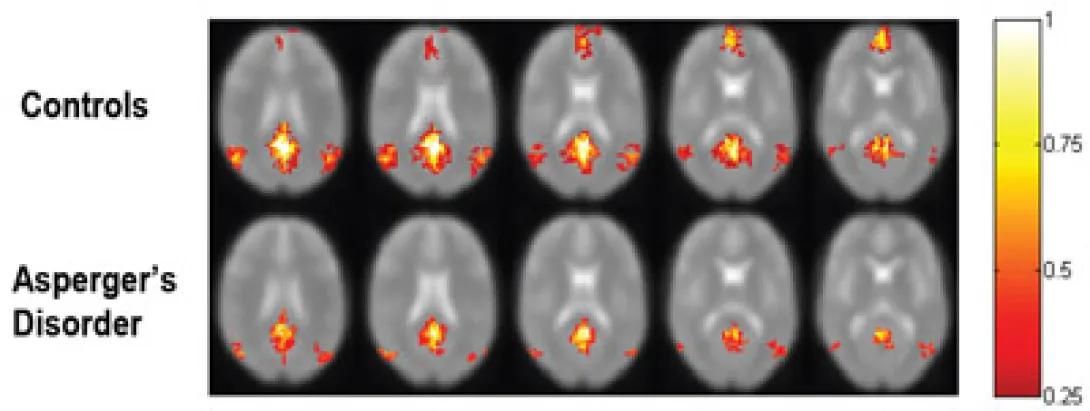
Figure showing reduced functional connectivity within the default mode network in subjects with Asperger's disorder as compared to healthy controls.
Two rows of axial brain MRI slices comparing groups labeled “Controls” (top row) and “Asperger’s Disorder” (bottom row). Each row shows multiple slices with red and yellow activation clusters overlaid on grayscale brain images.
The control group displays broader and more intense activation patterns, while the Asperger’s Disorder group shows more limited and focal activation.
A vertical color bar on the right ranges from approximately 0.25 in red to 1 in yellow, indicating activation strength.
Transcranial Magnetic Stimulation
Transcranial Magnetic Stimulation (TMS) is a technique to produce neuronal excitations in the brain non-invasively. A strong electric field is produced by a coil that is held next to the subject's head, and this field causes the neurons to fire. This is a useful research and therapy tool. At the fMRI laboratory, we are conducting several studies of cognitive function using TMS. We are also developing techniques to improve the targetting capabilities of the TMS technique, which is not very accurate in its current state.
Researchers: Luis Hernandez-Garcia
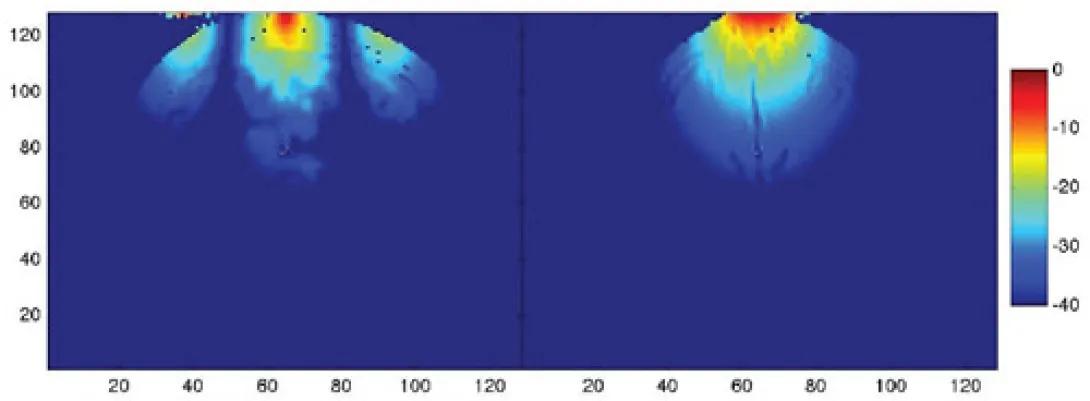
Calculated Electric Field Pattern produced on a human brain by a new TMS coil design.
Two side-by-side heatmap-style images on a dark blue background show intensity distributions near the top of each panel.
Bright regions in red and yellow appear at the upper center of both images, fading to green and blue toward lower values. A vertical color bar on the right ranges from 0 at the top (red) to −40 at the bottom (dark blue).
Axes with numeric tick marks are shown along the bottom and left edges.
