
MIAC Image Galleries
Confocal Microscopy and Image Analysis Expertise
Confocal Microscopy Images
Nikon A1 Images
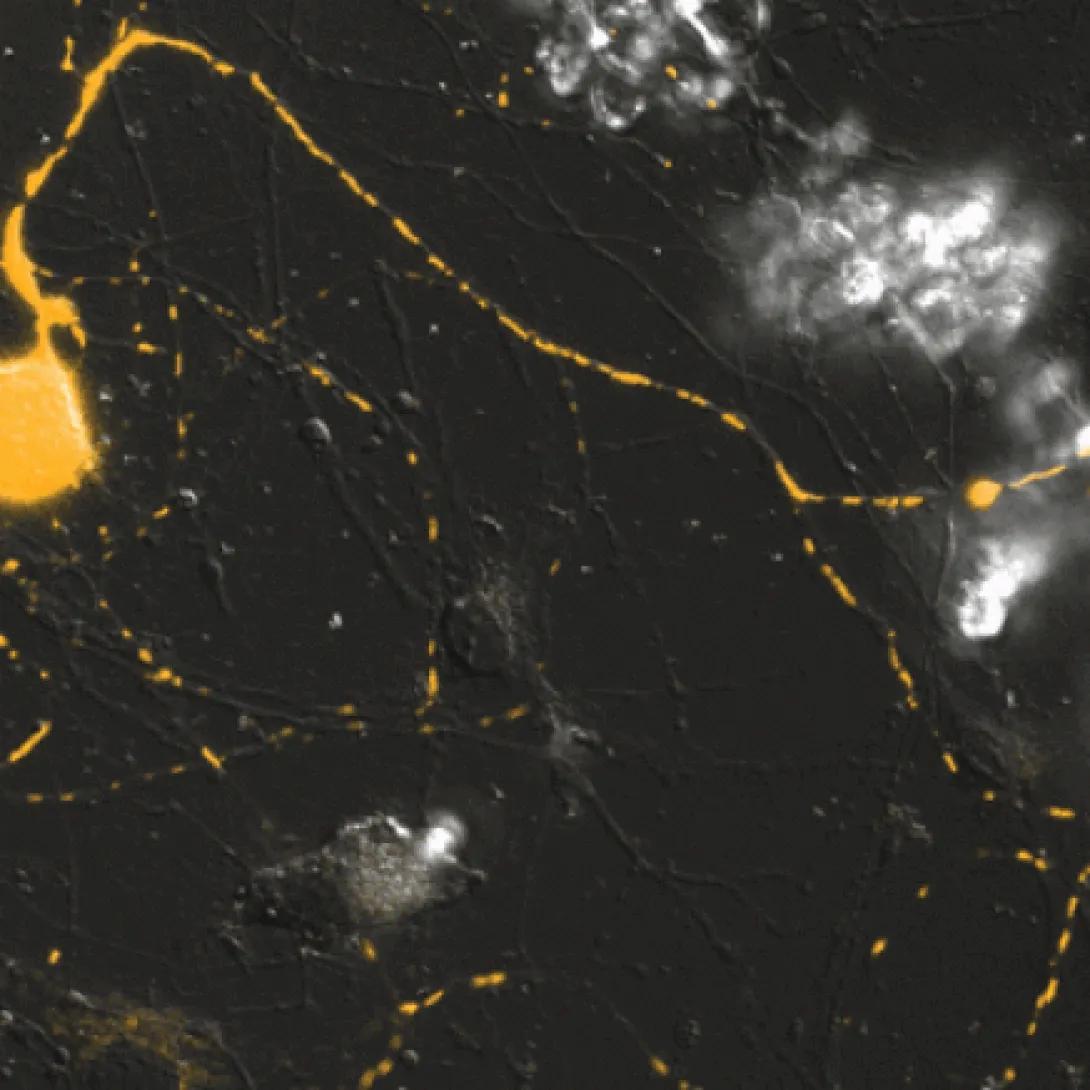
Time series images were taken on the Nikon A1 confocal microscope. Mitochondria were labeled with a Mito-RFP baculovirus in murine primary sensory neurons. Primary senosry neuron cultures were provided and imaged by Amy Rumora, Eva L. Feldman, MD PhD, Department of Neurology and Stephen I. Lentz, PhD, Laboratory Director of Imaging, MICPC.
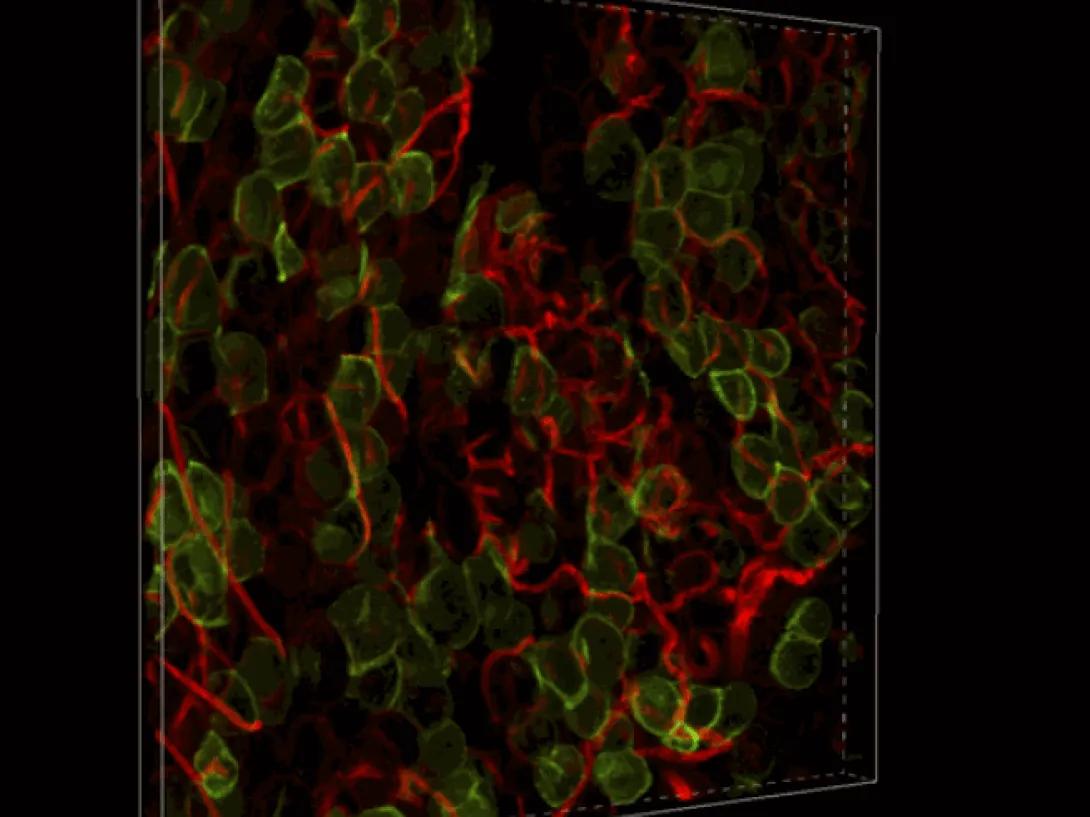
Transgenic mice expressed a Rosa26--loxP-memTom-loxP—memGFP x Adiponectin-CRE. Adipose tissue was imaged in z-series on the Nikon A1 confocal microscope and rendered in 3D with Imaris software by Ziru Li, Brian Learman, BS, and Ormond A. MacDougald, PhD, Department of Molecular and Integrated Physiology.
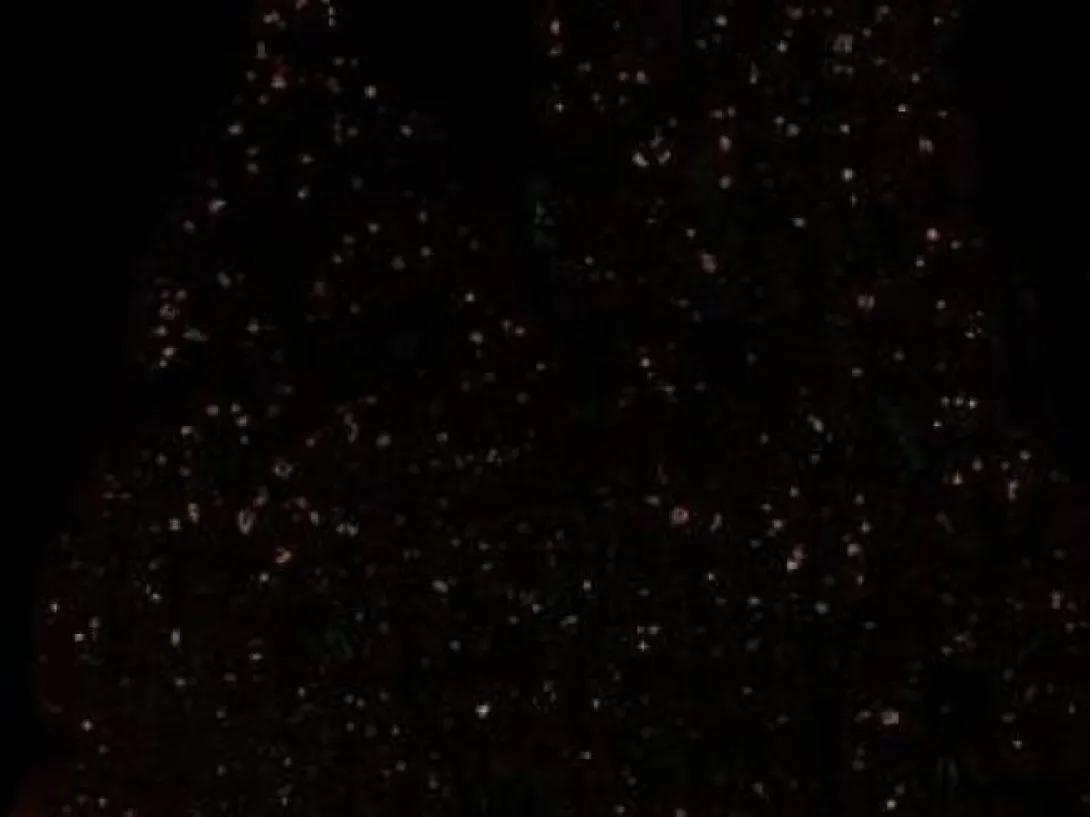
Islets in human pancreas tissue section
A 22x22 XY array was taken with a 10x objective on the Nikon A1 confocal microscope and stitched together with Nikon Elements software. Stained and imaged by Leena Haataja, PhD and Peter Arvan, MD, PhD, Department of Internal Medicine, Division of Metabolism, Endocrinology and Diabetes.
A single 10X view of islets. Human islet tissue was stained and imaged by Leena Haataja, PhD and Peter Arvan, MD, PhD, Department of Internal Medicine, Division of Metabolism, Endocrinology and Diabetes.
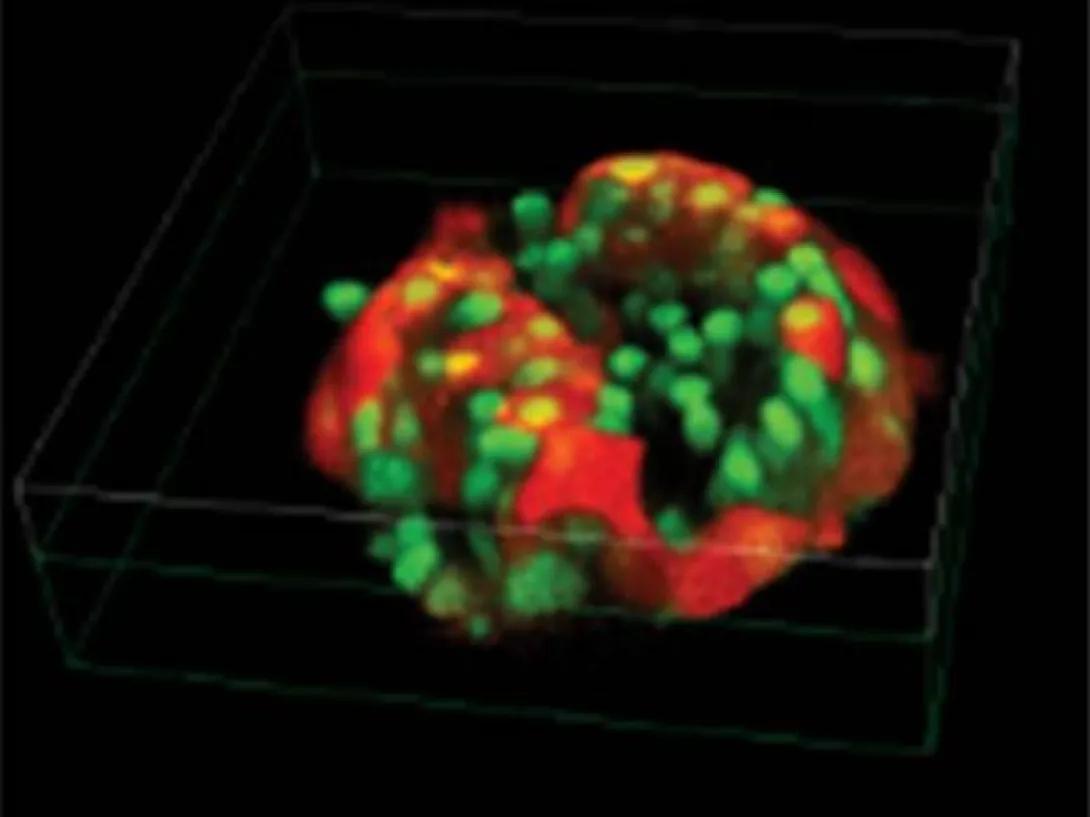
Confocal imaging shows the infection efficiency and penetration depth of adenovirus used to deliver PFK2/FBPase2 mutants, based on expression of an IRES2-linked Cherry (red). The islet was counterstained for 1 h at 37C with the cell-permeant dsDNA binding dye PicoGreen (green), which labeled nuclei strongly and mitochondria weakly, and imaged live on the Nikon A1 confocal microscope by Matthew J. Merrins, PhD and Leslie Satin, PhD, Department of Pharmacology.
Olympus FV500 LSCM Images
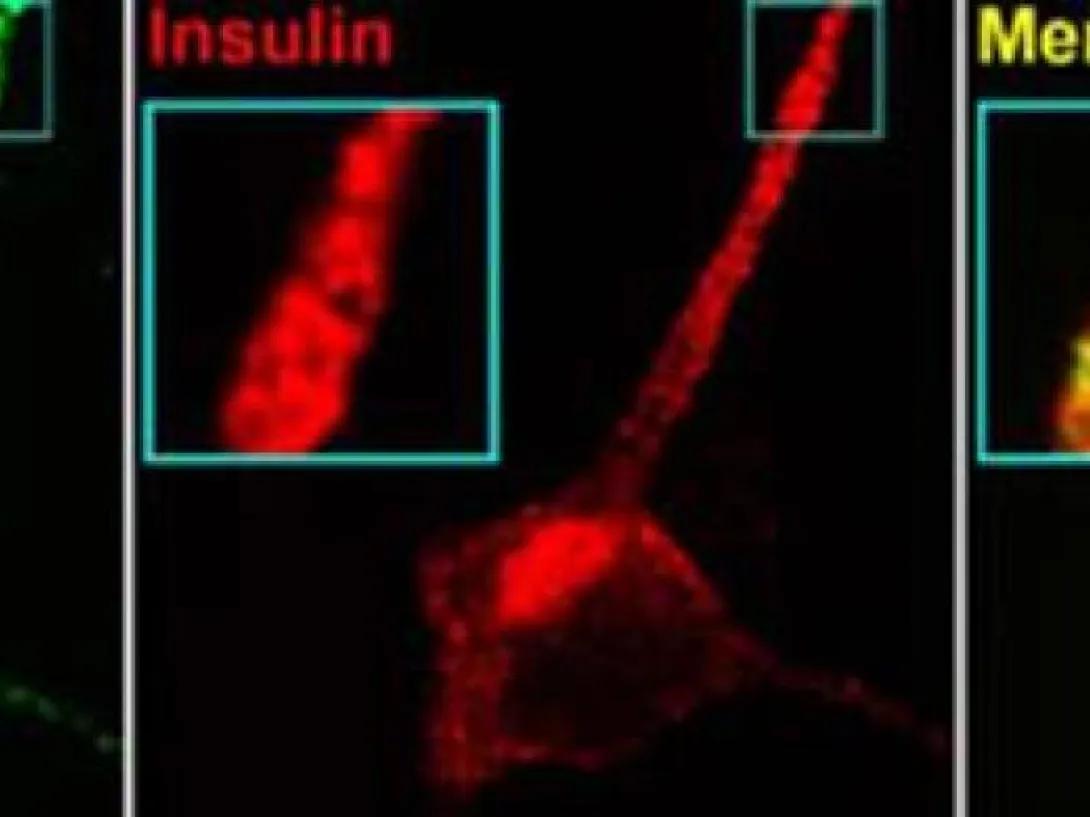
Colocalization of Zn++ transporter (green) and insulin (red) within insulin secretory granules of INS-1 rat pancreatic cell line. Cells were imaged on the Olympus FV500 confocal microscope by Antonio R. Lara-Lemus , MD, PhD and Peter Arvan, MD, PhD, Department of Internal Medicine, Division of Metabolism, Endocrinology & Diabetes, University of Michigan.
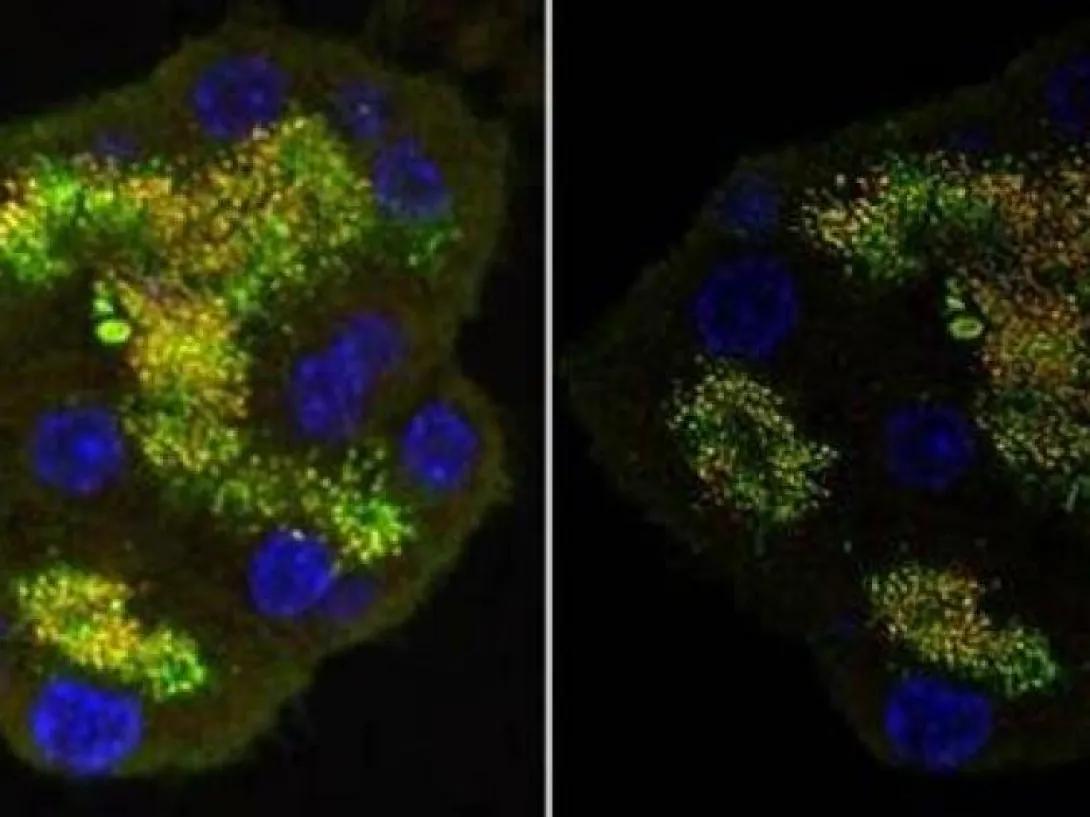
Pancreatic acini were stained with synaptic vesicle markers (green and red) and nuclei (blue). The image on the left is the original image taken on the Olympus FV500 microscope and the image on the right is the same image that is restored with AutoQuant deconvolution software.
Isolated pancreatic acini were made in the Laboratory of John A. Williams, MD, PhD, Department of Neurology, University of Michigan
Staining and images were done by Stephen A. Ernst, PhD, Department of Cell and Developmental Biology, University of Michigan.
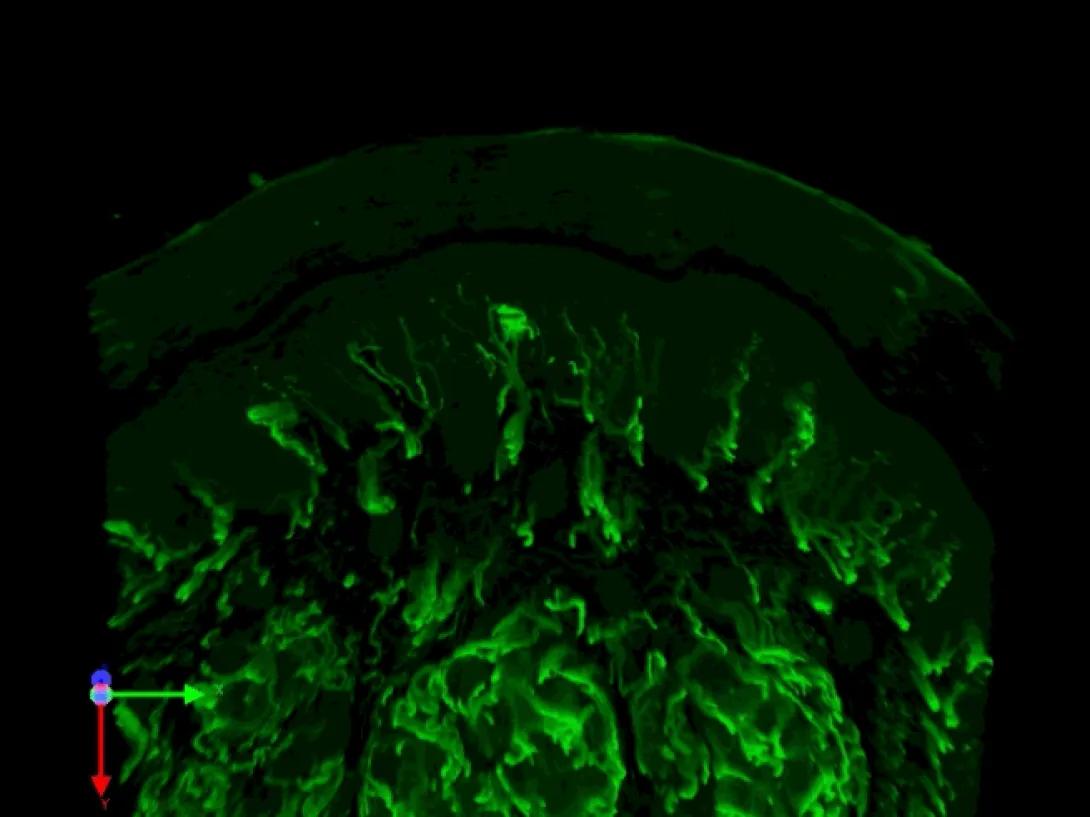
Mouse footpads were sectioned at 30 μm and stained for intraepidermal nerve fibers (Protein Gene Product 9.5, green). A z-series was taken on the Olympus FV500 confocal microscope and then Volocity software was used to visualize and animate the 3 dimensional signal.
Mouse footpads were isolated in the Laboratory of Eva L. Feldman, MD, PhD, Department of Neurology, University of Michigan
Staining and images were done by John M. Hayes, BS, Department of Neurology, University of Michigan
Tissue Sections of Pancreatic Islets from 4 Week Old Control (Wistar) and Diabetic (ZDF) Rats Stained with Antibodies Against Insulin and Nestin
Tissue section of pancreatic islets stained with antibodies against insulin
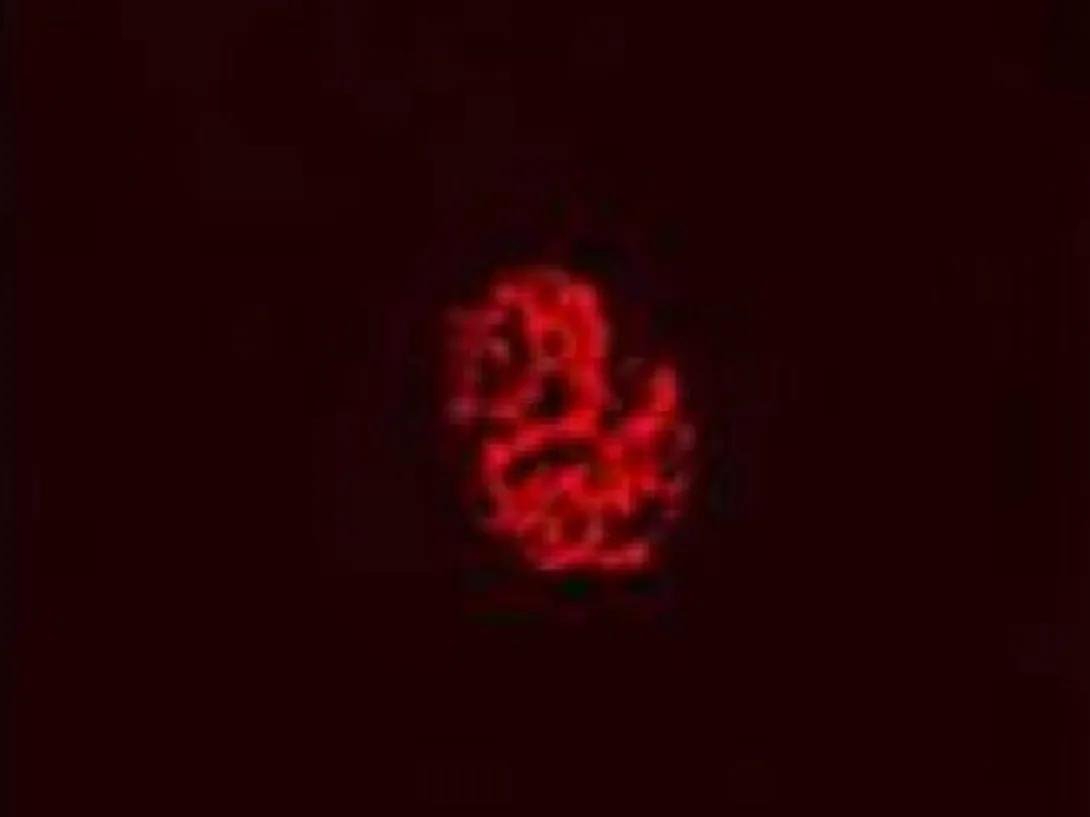
Tissue section of pancreatic islets from 4 week old diabetic (ZDF) rats stained with antibodies against insulin
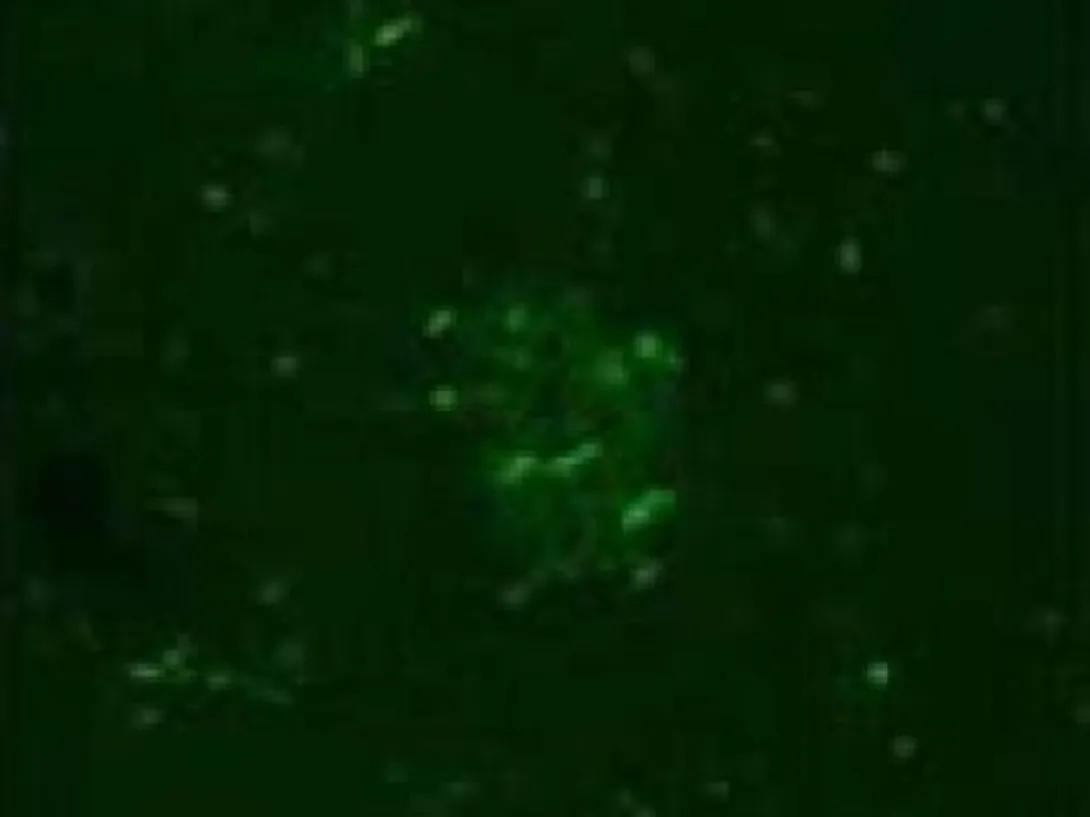
Tissue section of pancreatic islets from 4 week old control (Wistar) rats stained with antibodies against insulin
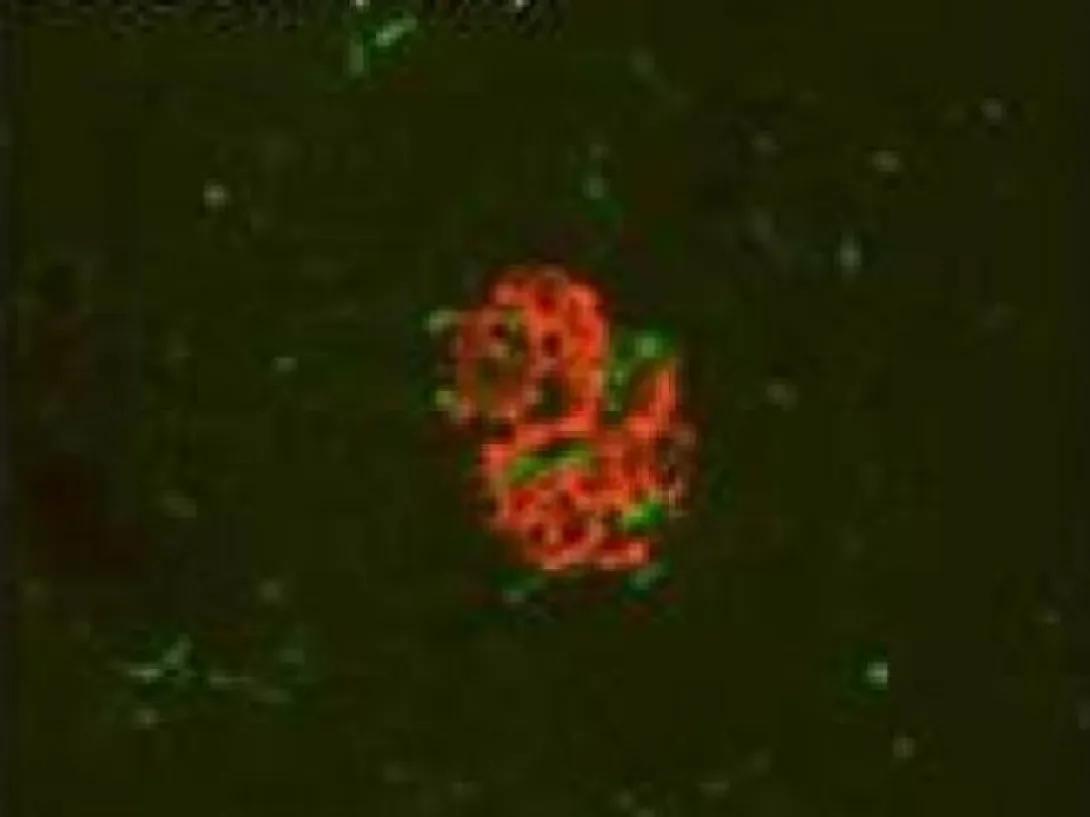
Tissue section of pancreatic islets stained with antibodies against insulin
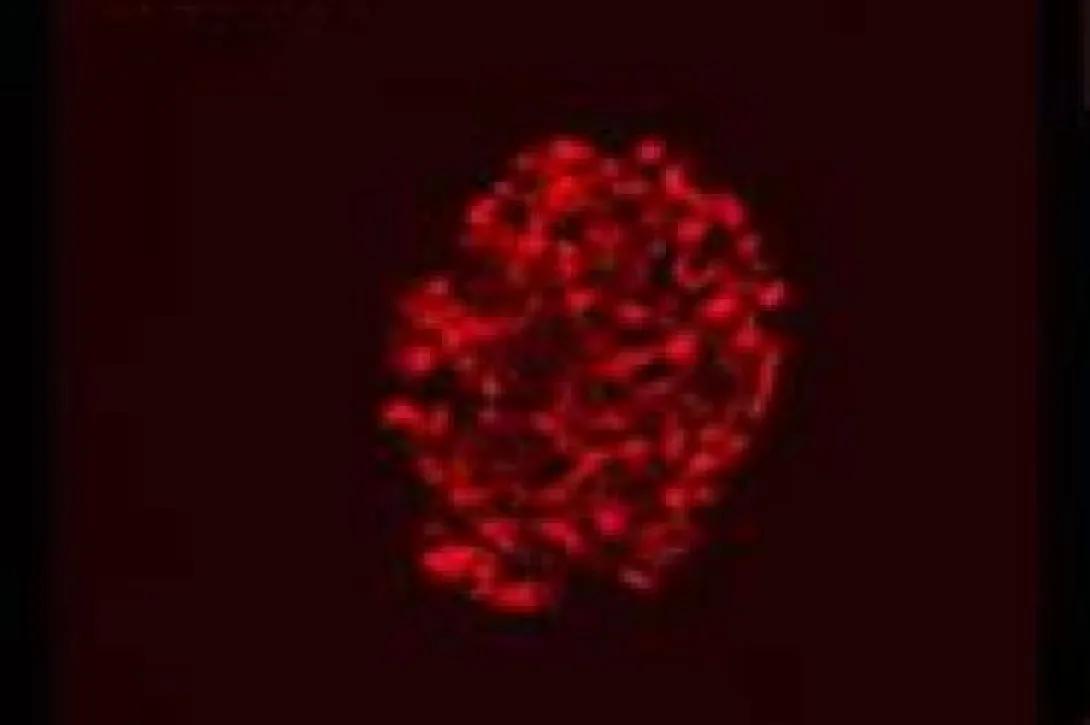
Tissue section of pancreatic islets from 4 week old diabetic (ZDF) rats stained with antibodies against insulin
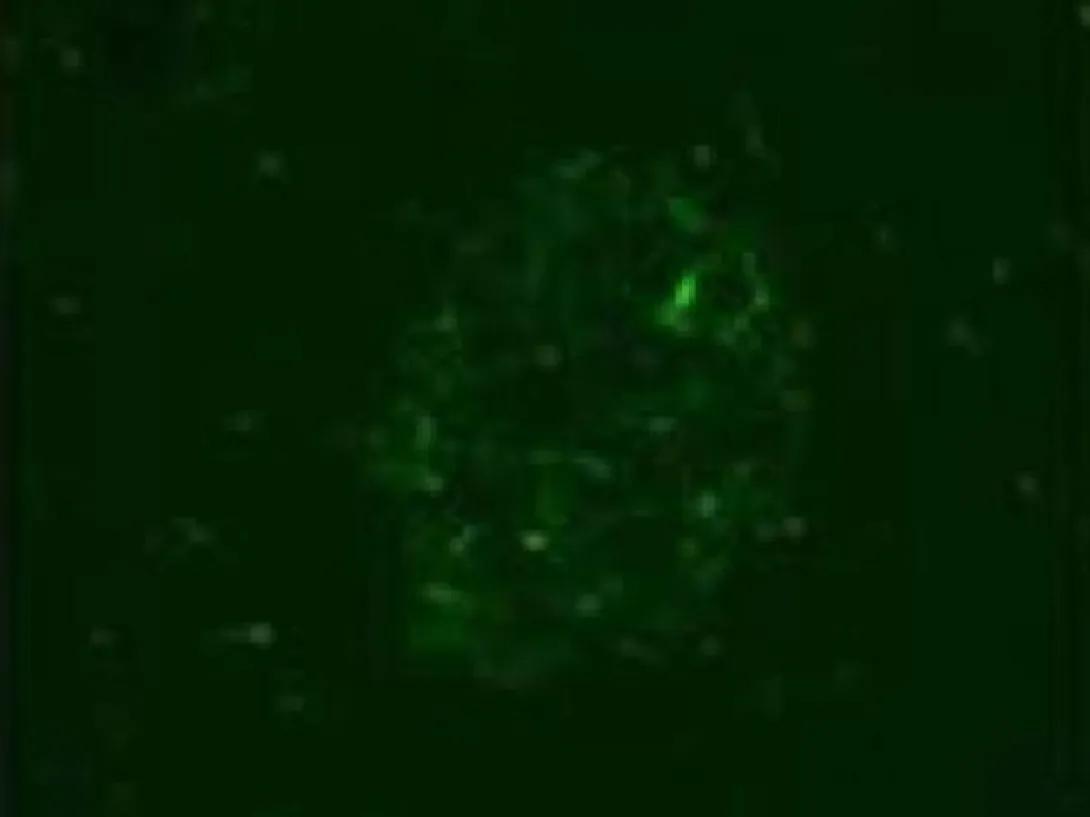
Tissue section of pancreatic islets from 4 week old control (Wistar) rats stained with antibodies against insulin
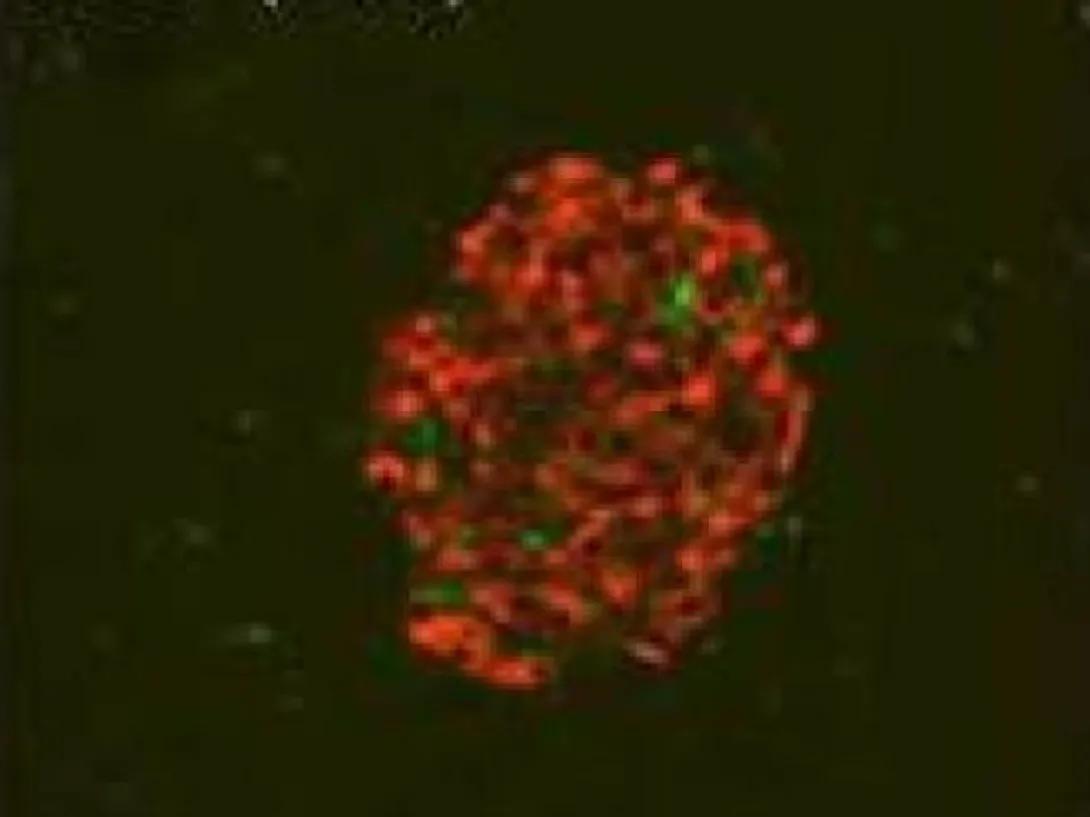
Tissue section of Nestin with +RBC autofluorescence
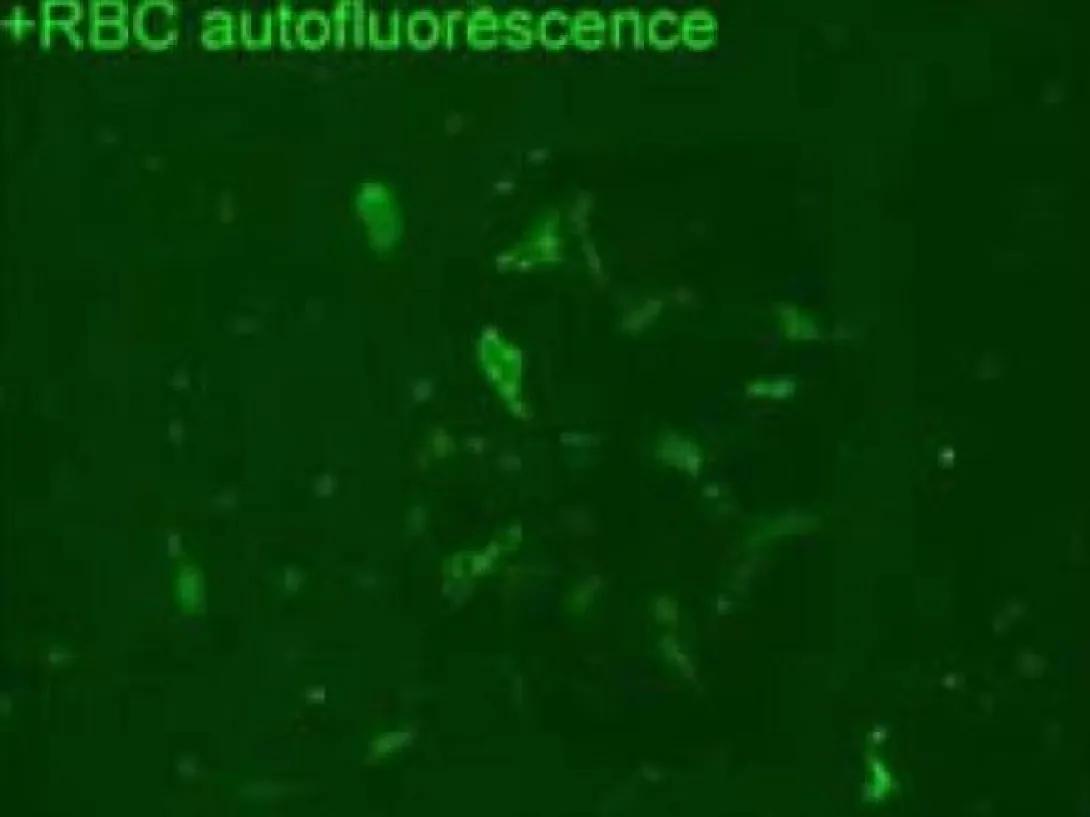
Tissue section RBC
Overlapping tissue sections
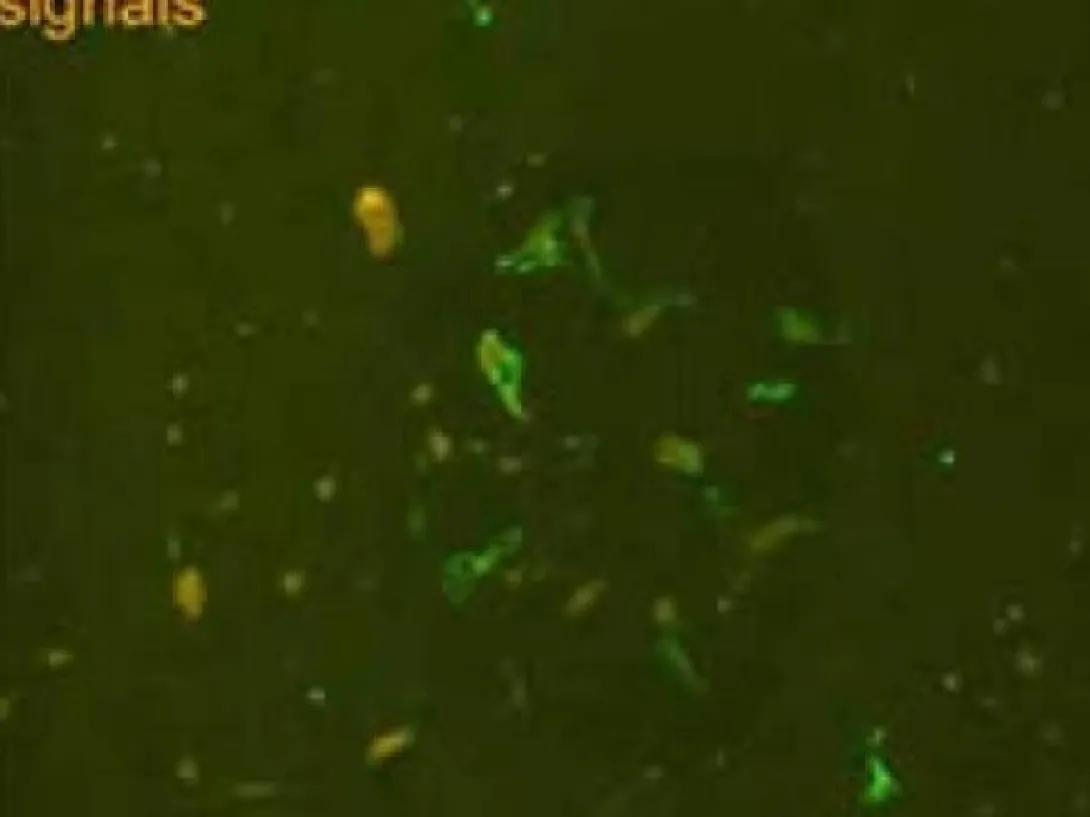
Nestin +RBC autofluorescence
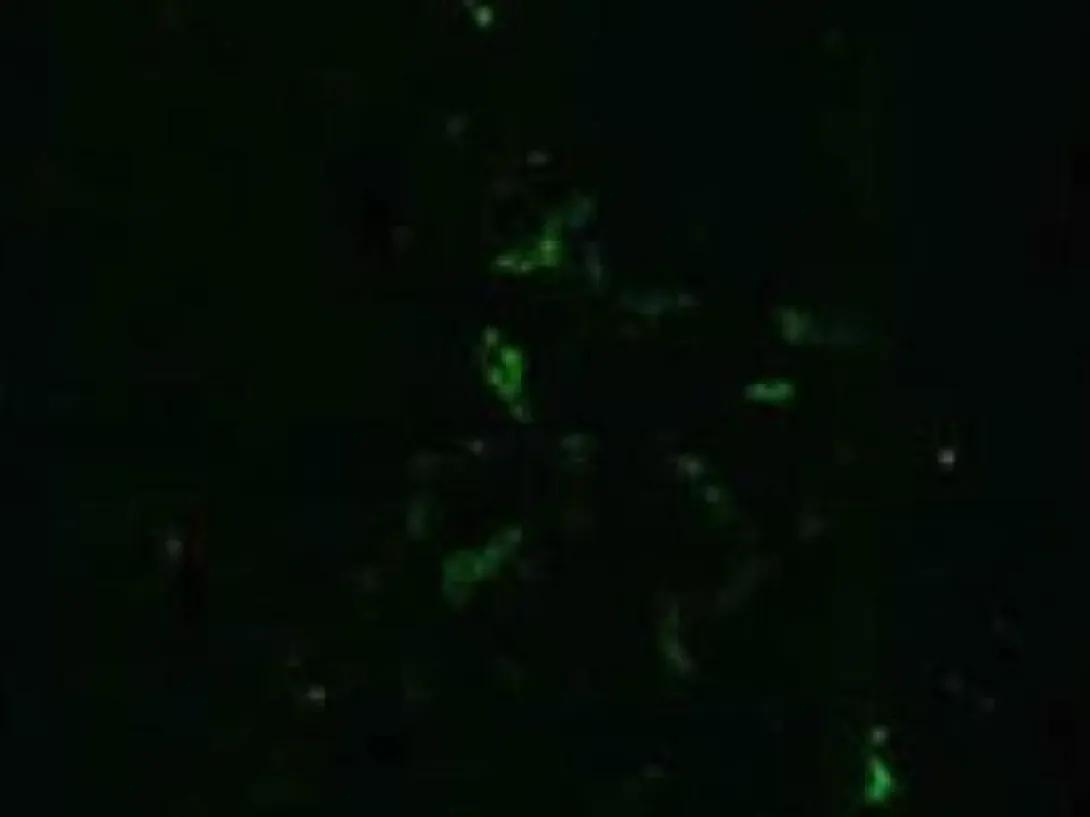
Images can be processed to subtract auto fluorescence associated with red blood cells (RBC)
From the laboratory of Charles Burant, MD, PhD, Department of Internal Medicine, University of Michigan
Micrographs courtesy of Stephen Lentz, PhD, Laboratory Director of MIAC, University of Michigan
Micrographs courtesy of Paula B. Goforth, PhD, Department of Pharmacology and Martin G. Myers, MD, PhD, Department of Internal Medicine, Division of Metabolism, Endocrinology and Diabetes, University of Michigan
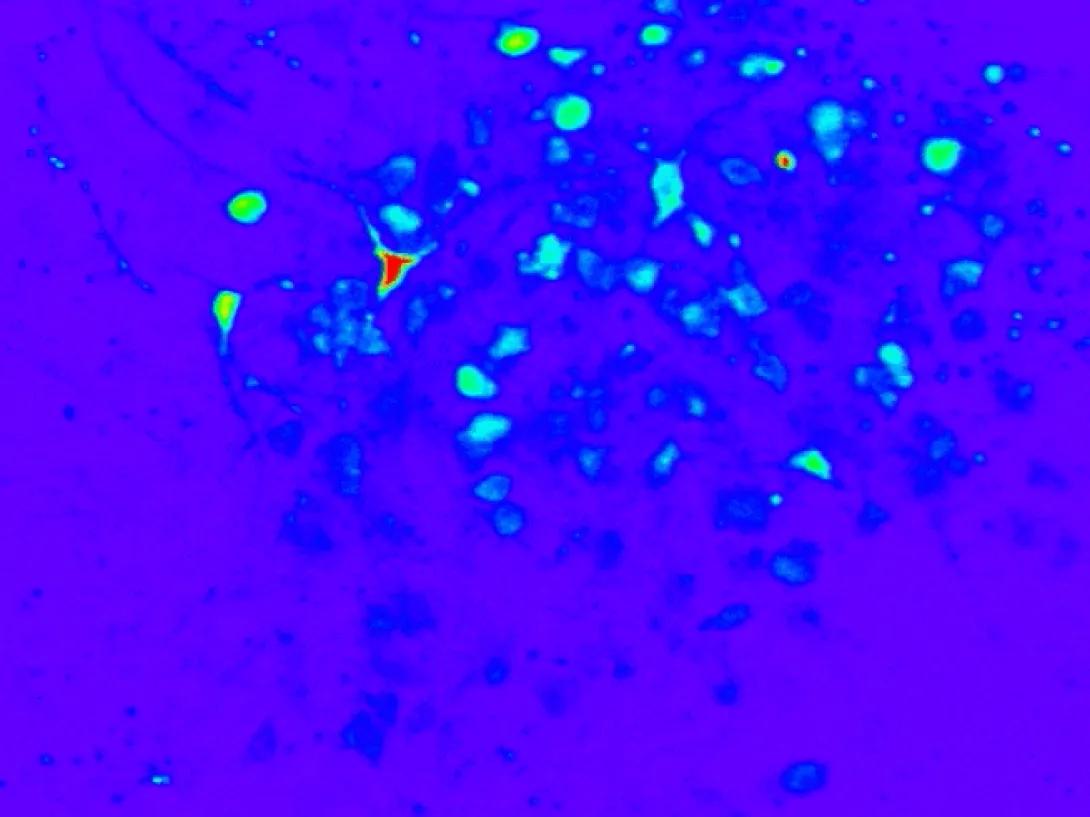
Three-Dimensional Imagery
Morphometric Analysis/Imaris
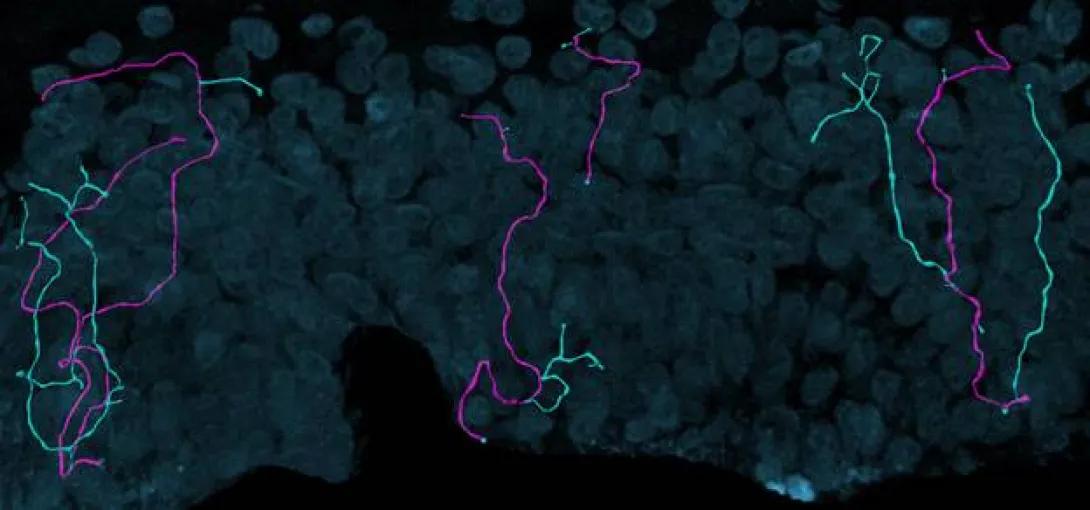
Measurements of Intraepidermal Nerve Fiber
Fluorescent z-series images were collected on the Leica SP5 confocal microscope (nuclei of keratinocytes are shown as cyan). Intraepidermal nerve fibers (magenta) and branches (cyan) were rendered in 3D and measured with Imaris software. Alexandra Münch, Nicholas Rebhan & Eva L. Feldman, MD PhD Department of Neurology.
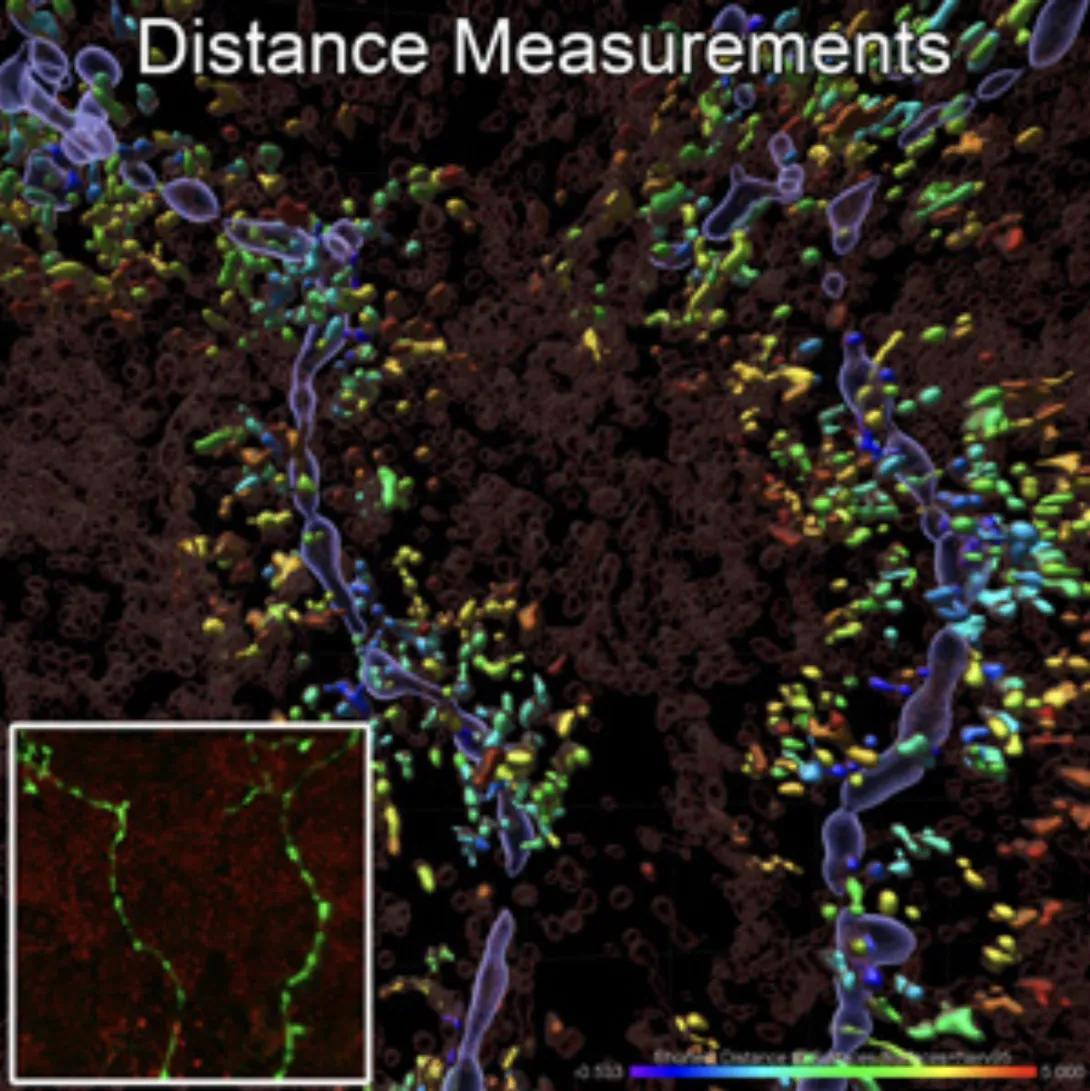
Distance Measurements of Mitochondria near Nerve Fibers/Imaris
Fluorescent z-series images were collected on the Nikon A1 confocal microscope (inset of the image, nerves green, mitochondria red). Surfaces of intraepidermal nerve fibers (translucent violet) and mitochondria (translucent red and colored-coded by distance from nerve surface up to 5 µm away) were rendered in 3D and measured with Imaris software. John, M. Hayes & Eva L. Feldman, MD PhD Department of Neurology, Stephen I. Lentz, Laboratory Director of Imaging of the MIAC.
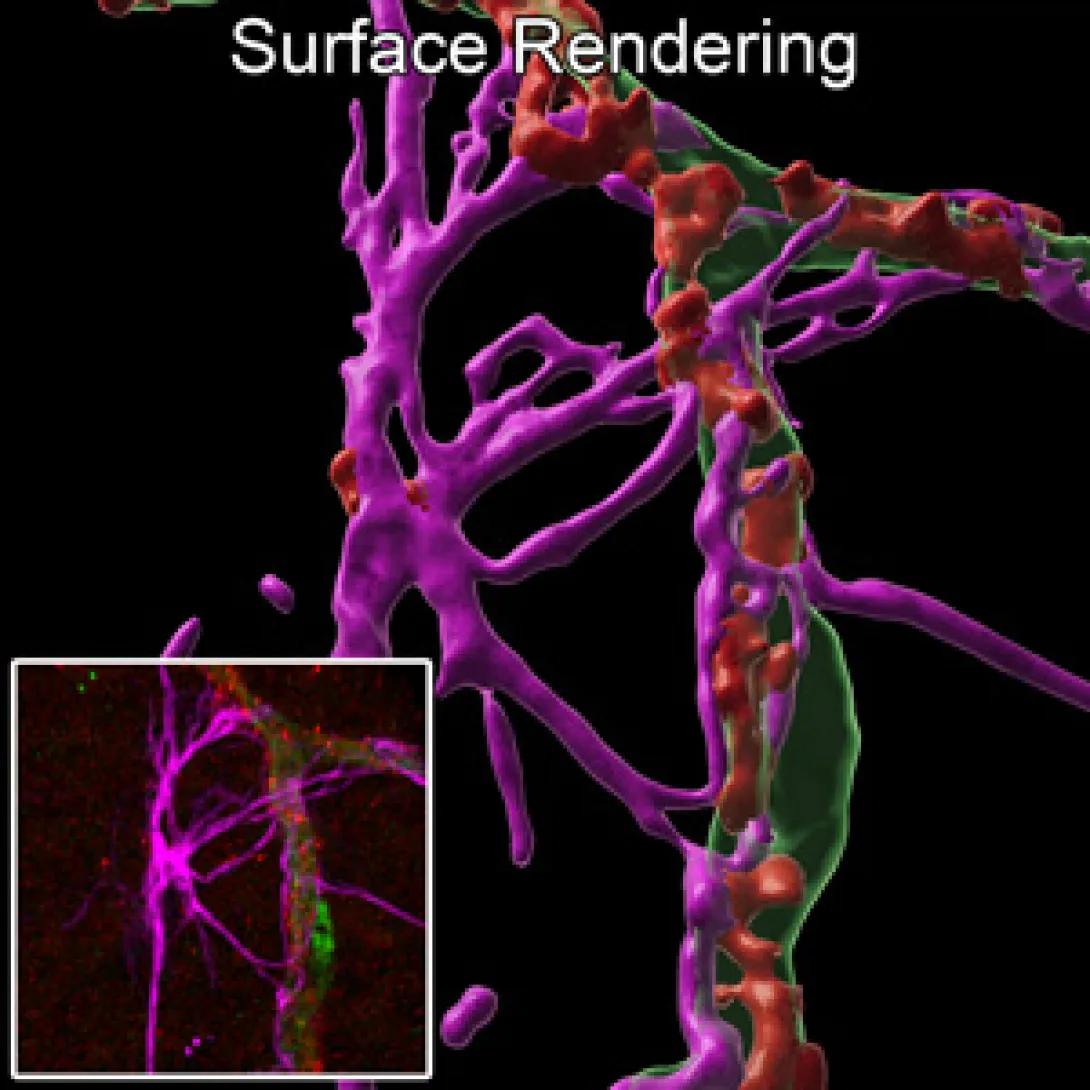
Surface Rendering of Retinal Vasculature/Imaris
Fluorescent z-series images were collected on the Stellaris 8 confocal microscope (inset of the original fluorescence image). Surface renderings were made in Imaris to show the retinal vasculature, tight junctions, and associated cells. Xuwen Liu, PhD and David Antonetti, PhD, Department of Ophthalmology and Visual Sciences.
Morphometric Analysis/MetaMorph
Fluorescence Recovery After Photo Bleaching
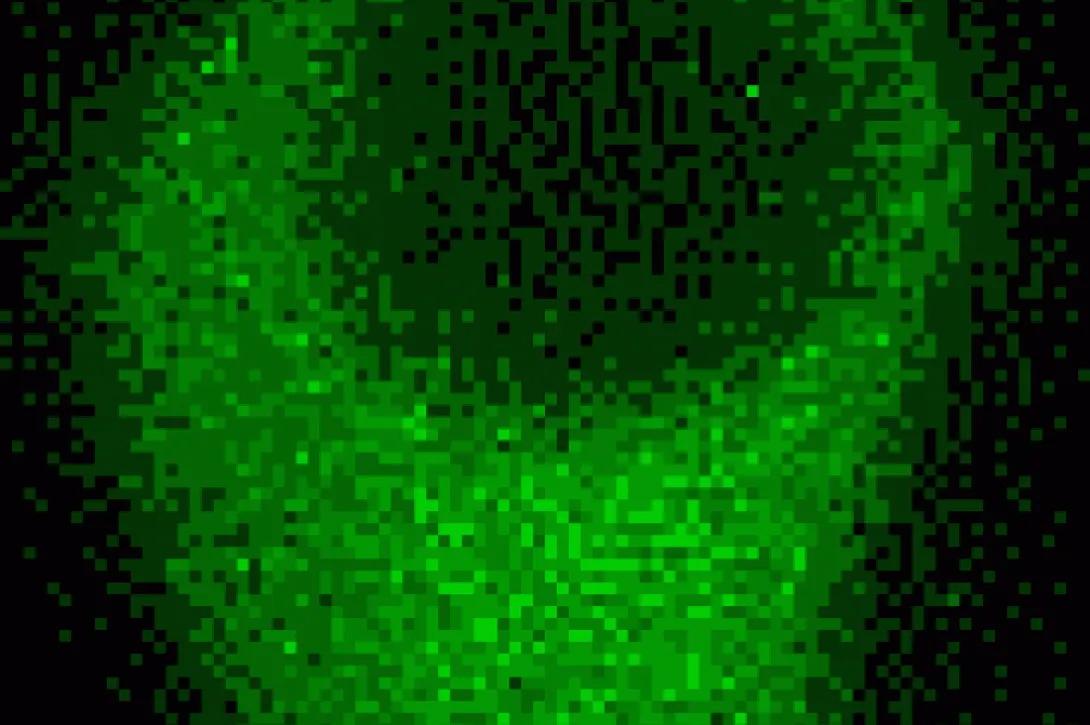
Image shows regions of interest of the bleached area in green.
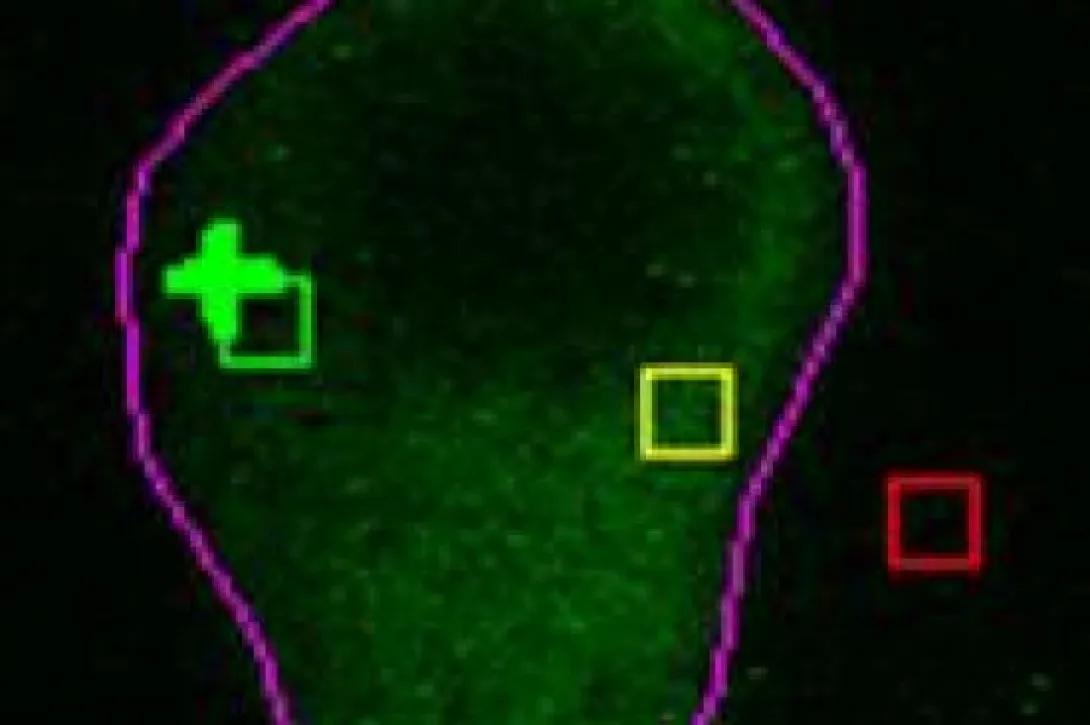
Image shows regions of interest of the bleached area in green, adjacent bleached area in yellow, whole cell outline in magenta, and the outside of the cell, which is indicated to the right in red.
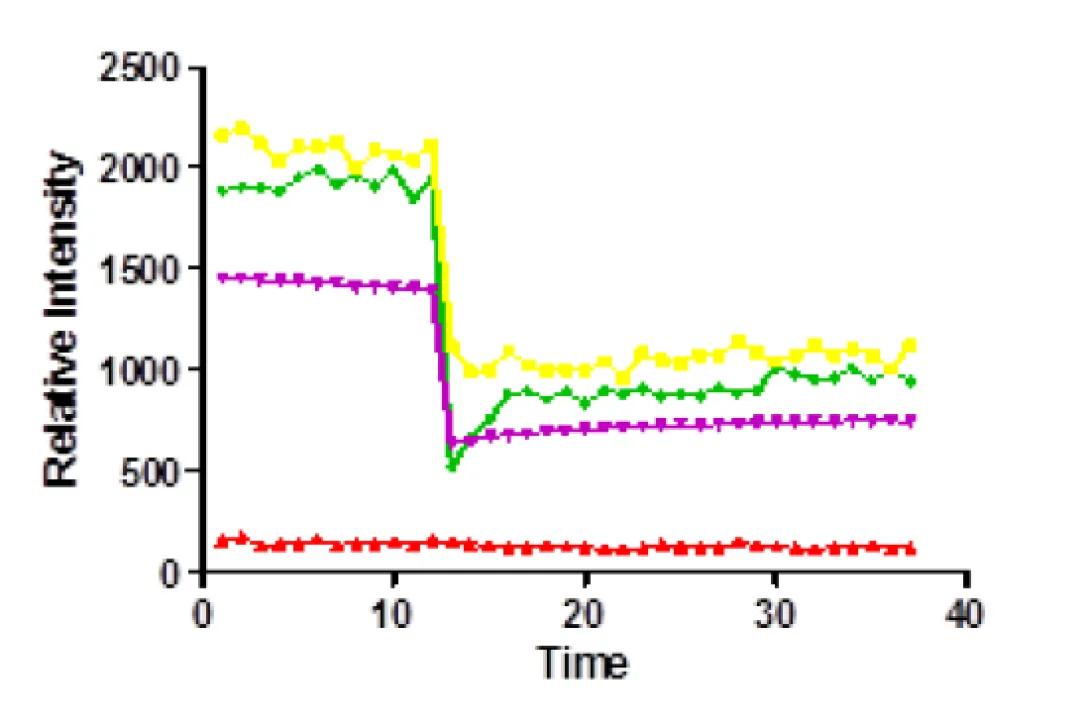
Graph showing relative intensity compared to time, where relative intensity decreases (inside of the cell) over time.
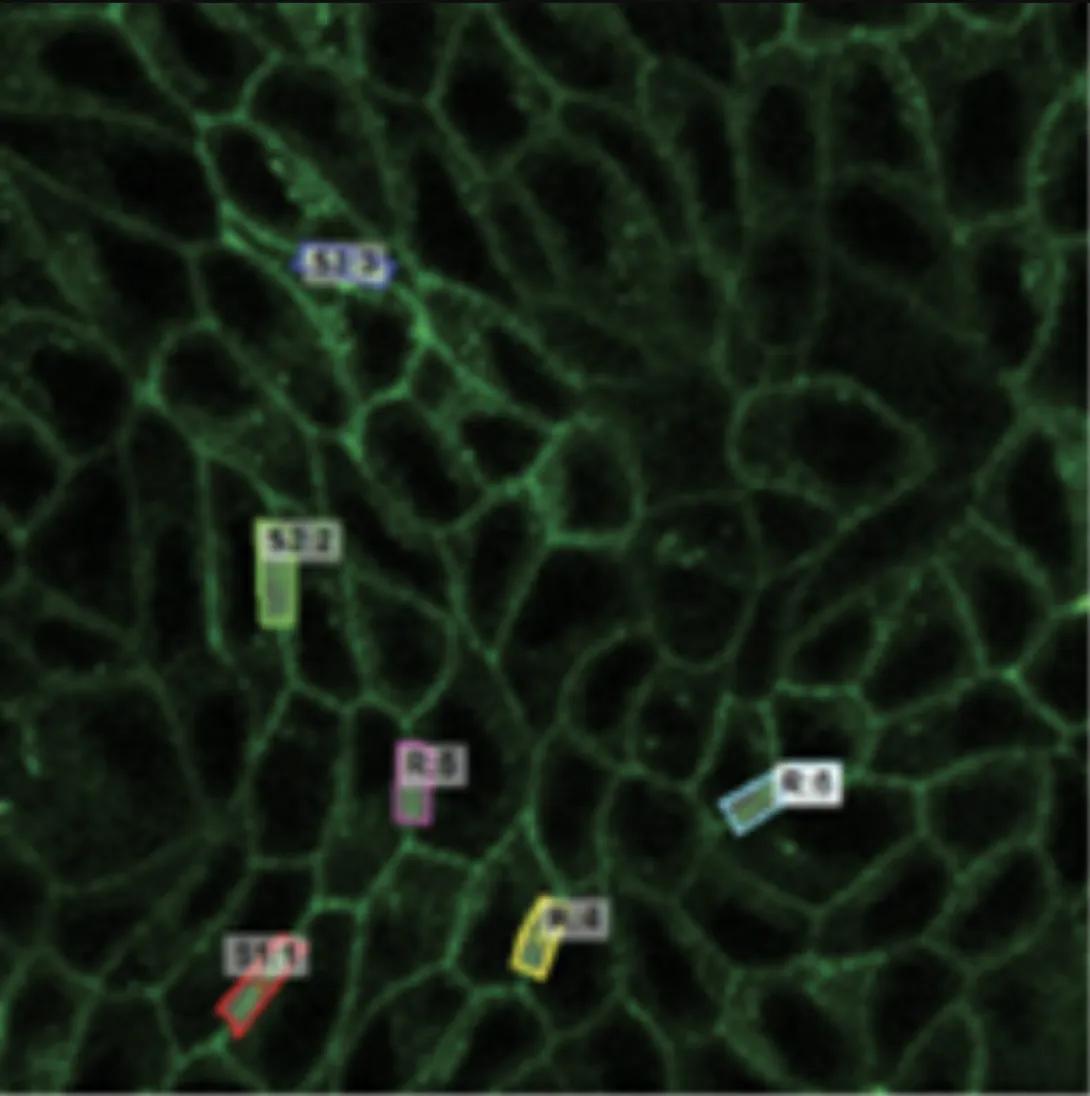
Image shows the fluorescent signals within the regions of interest of the bleached area are indicated on the image, with S1:1 red, S2:2 green, and S3:3 blue labels. The areas away from the bleached area are indicated by R:4 yellow, R:5 magenta, and R:6 cyan labels.
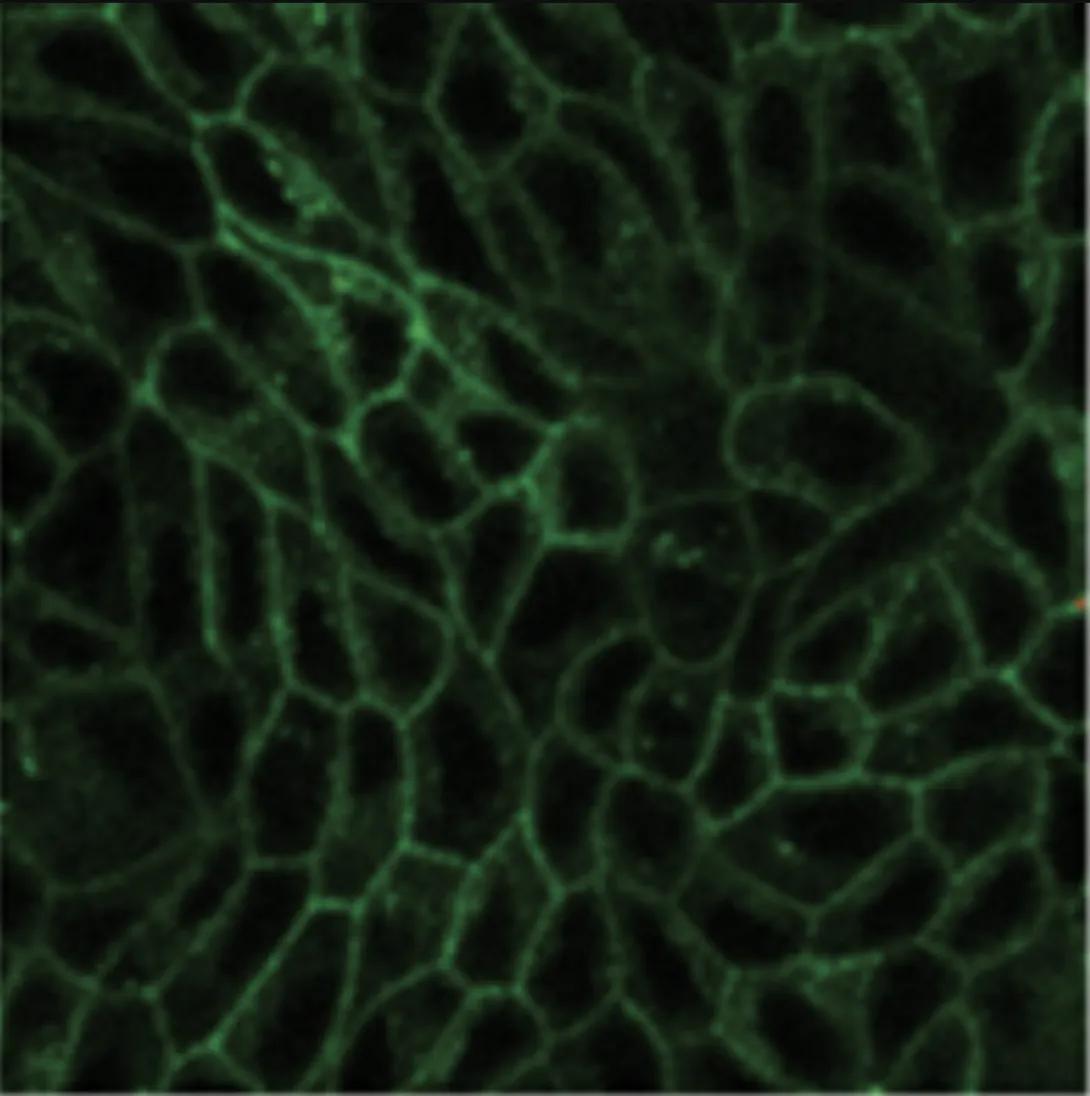
Image shows the base image, without labels overlaid on top.
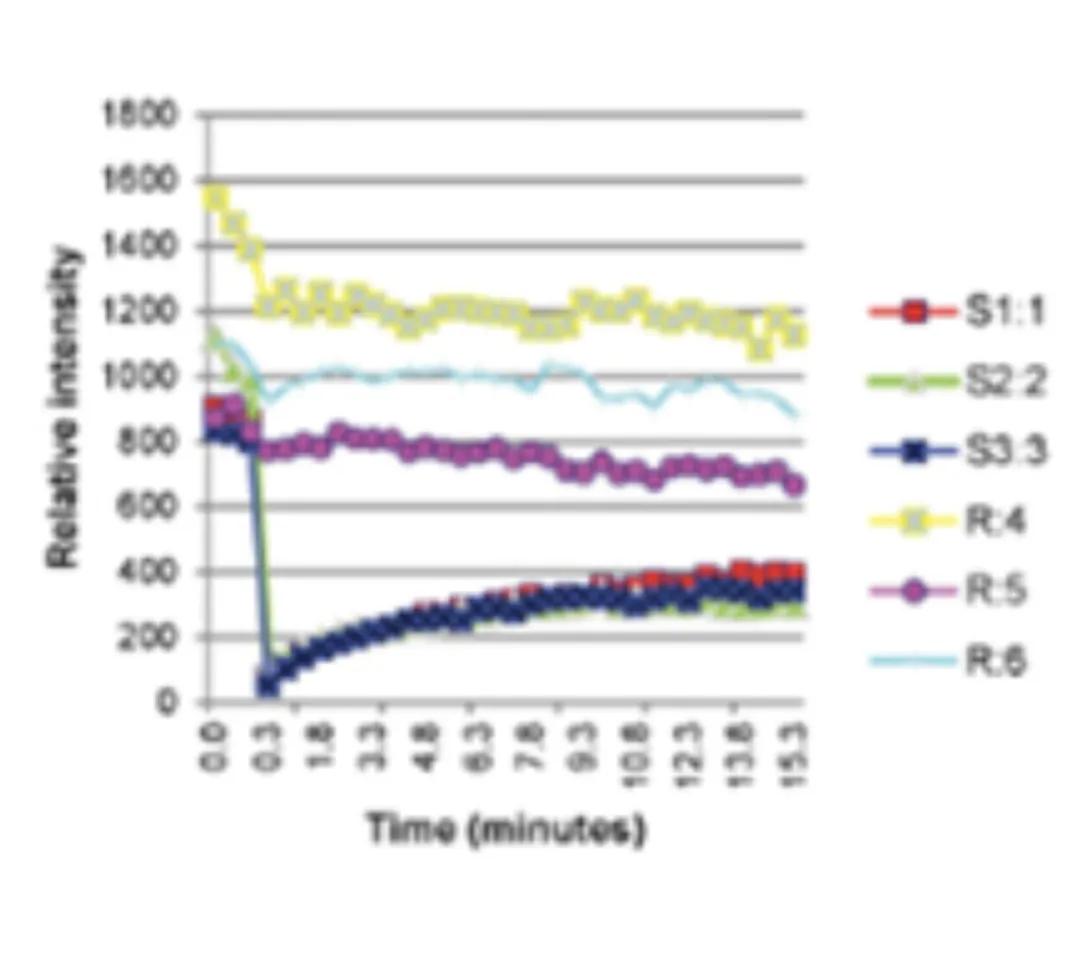
Graph showing relative intensity compared to time (in minutes), where relative intensity shows a steep decrease at first and then a gradual increase over time for the regions of interest of the bleached area.
Mitochondria Trafficking
Time series images were taken on the Nikon A1 confocal microscope. Mitochondria were labeled with a fluorescent signals in murine primary sensory neurons. Mitochondria trafficking in neurites was done with kymograph analysis using MetaMorph software. Primary sensory neuron cultures were provided and imaged by Amy Rumora, Eva L. Feldman, MD PhD, Department of Neurology and Stephen I. Lentz, PhD, Laboratory Director of Imaging, MIAC.
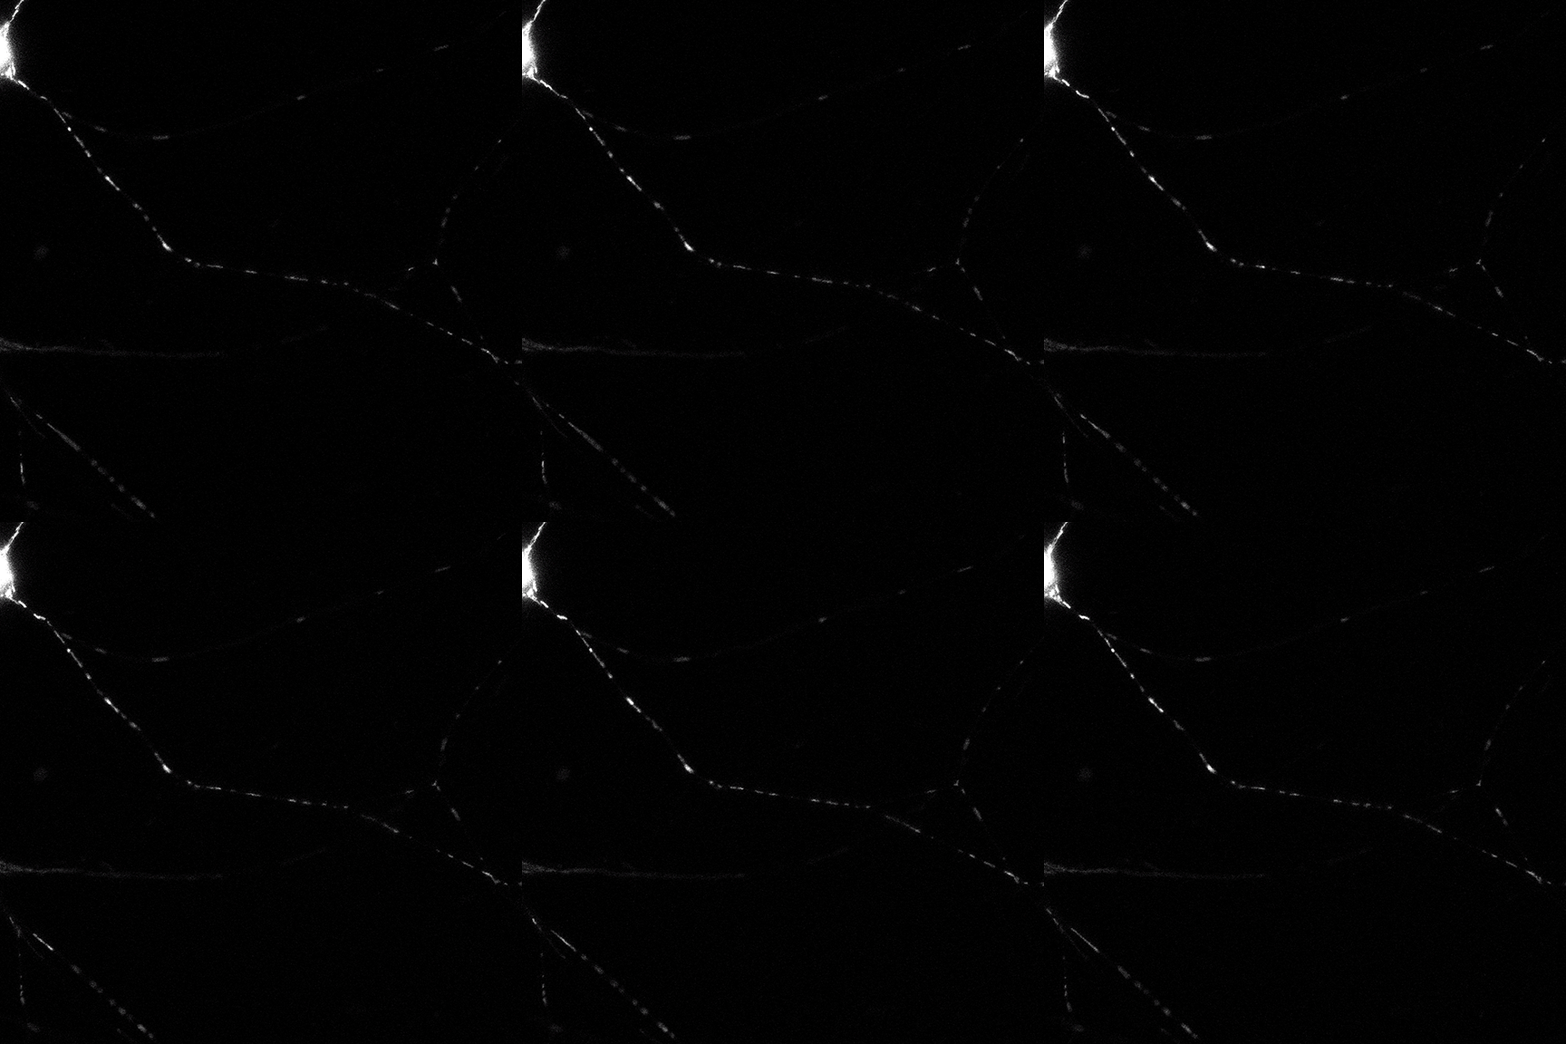
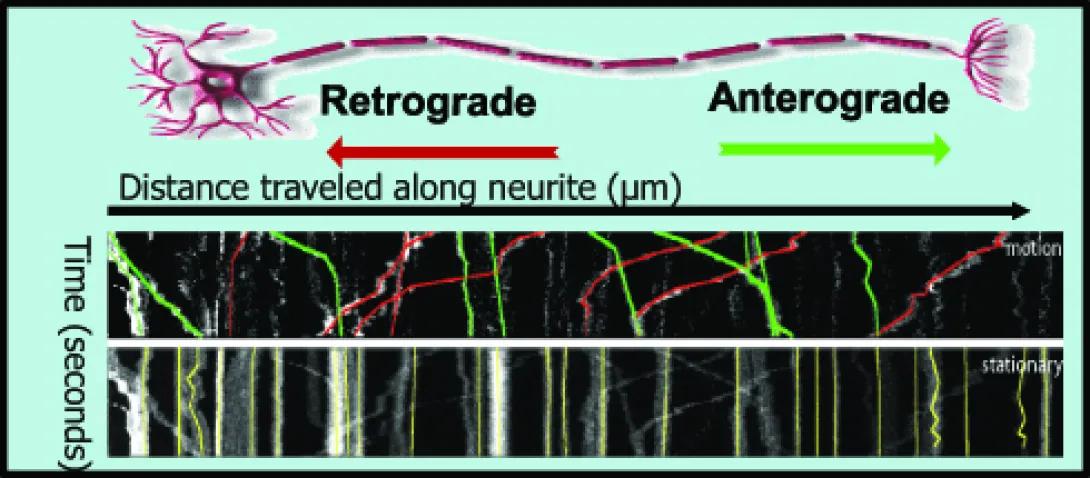
Graph shows distance traveled along neurite (retrograde to anterograde) over time in seconds
G-ratio Measurements in Mouse Seral Nerve
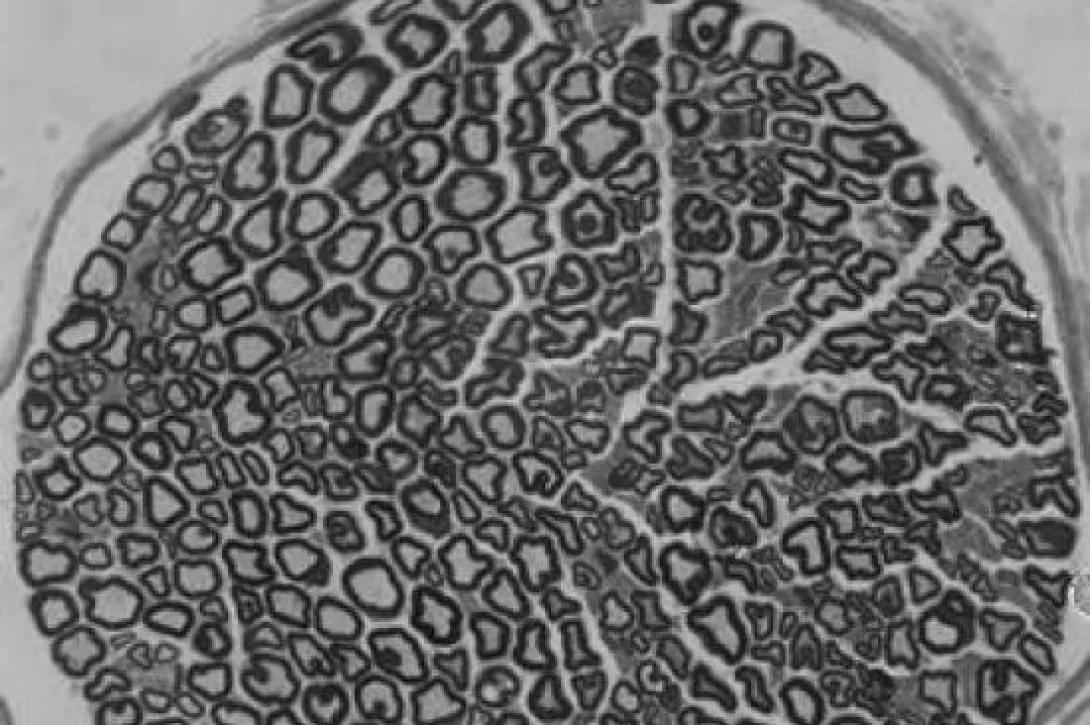
TEM image in black and white
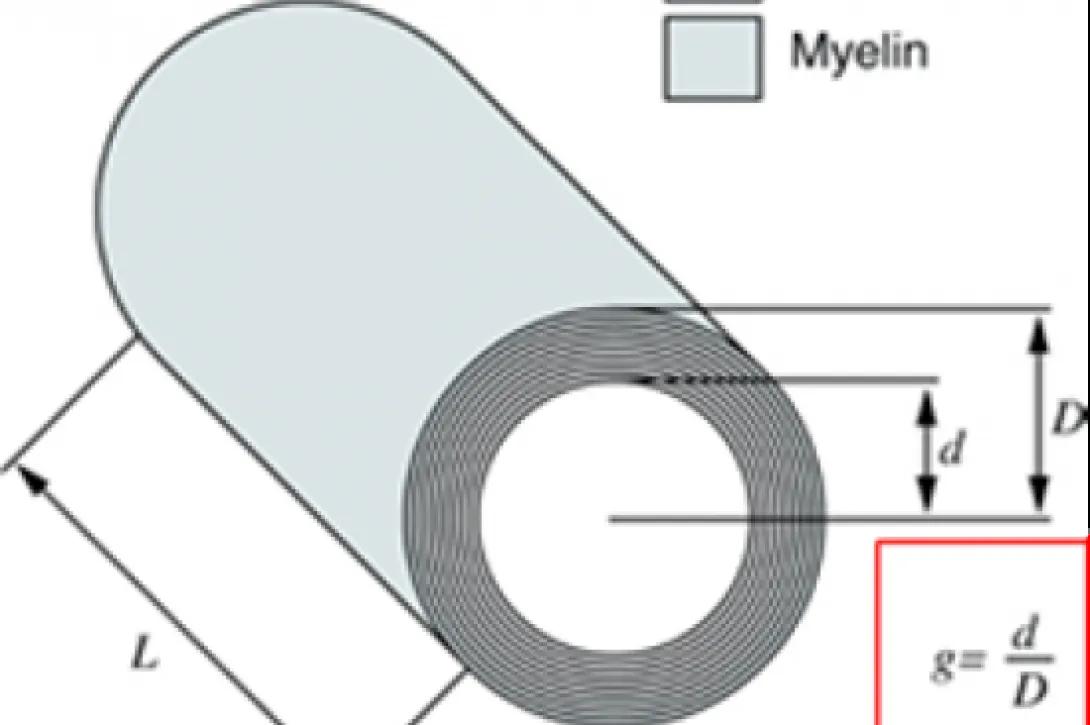
Myelin measurements where g equals d over D
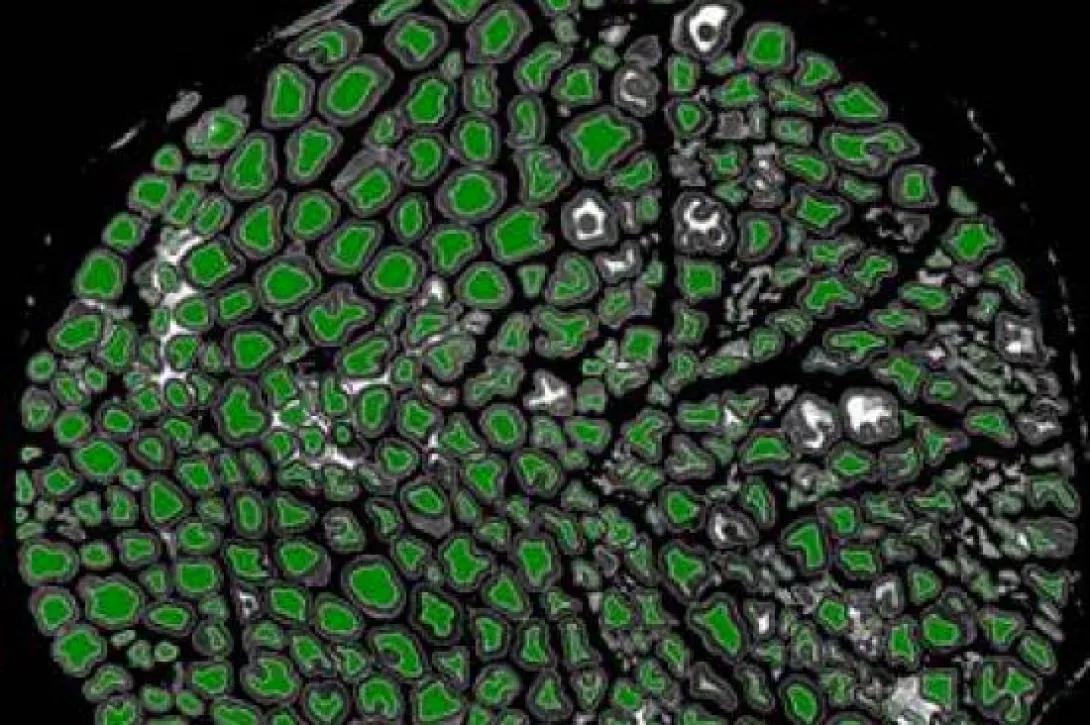
TEM image in black, green, and white
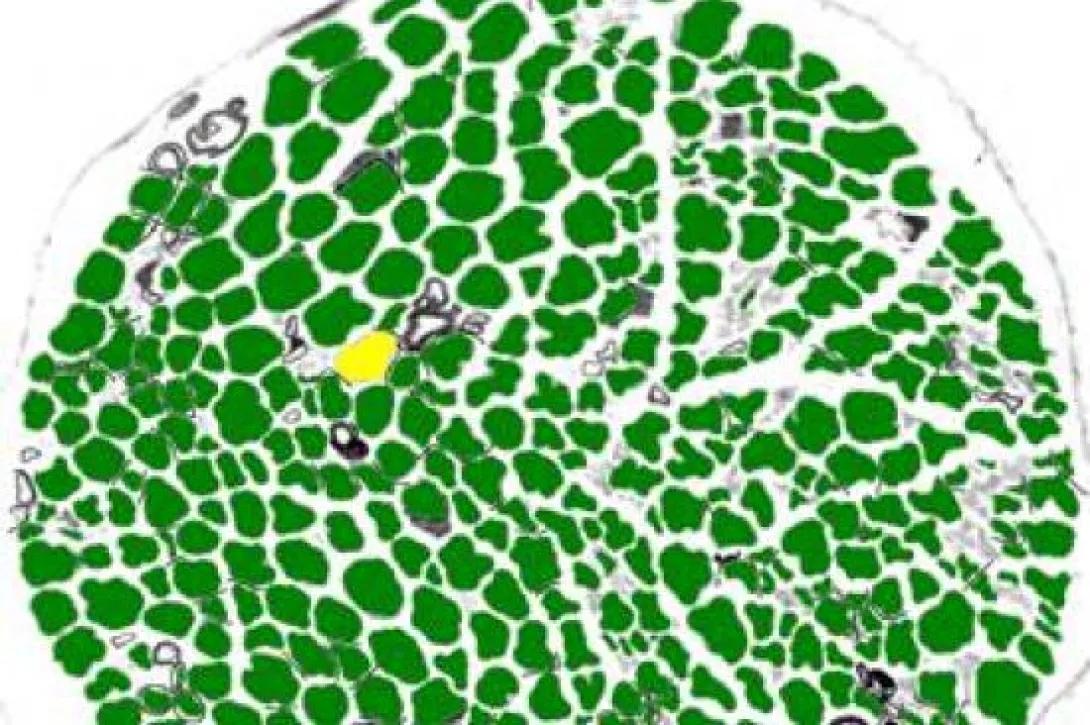
TEM image in white, green and yellow
Adipocyte Measurements
Original images were collected on a Nikon microscope. Image contrast was enhanced with PhotoShop. Adipocyte area and number were measured with MetaMorph software and data was plotted with Prism software by Tyler C. Prestwich, Sebastian D. Parlee, PhD and Ormond A. MacDougald, PhD Department of Molecular and Integrative Physiology.
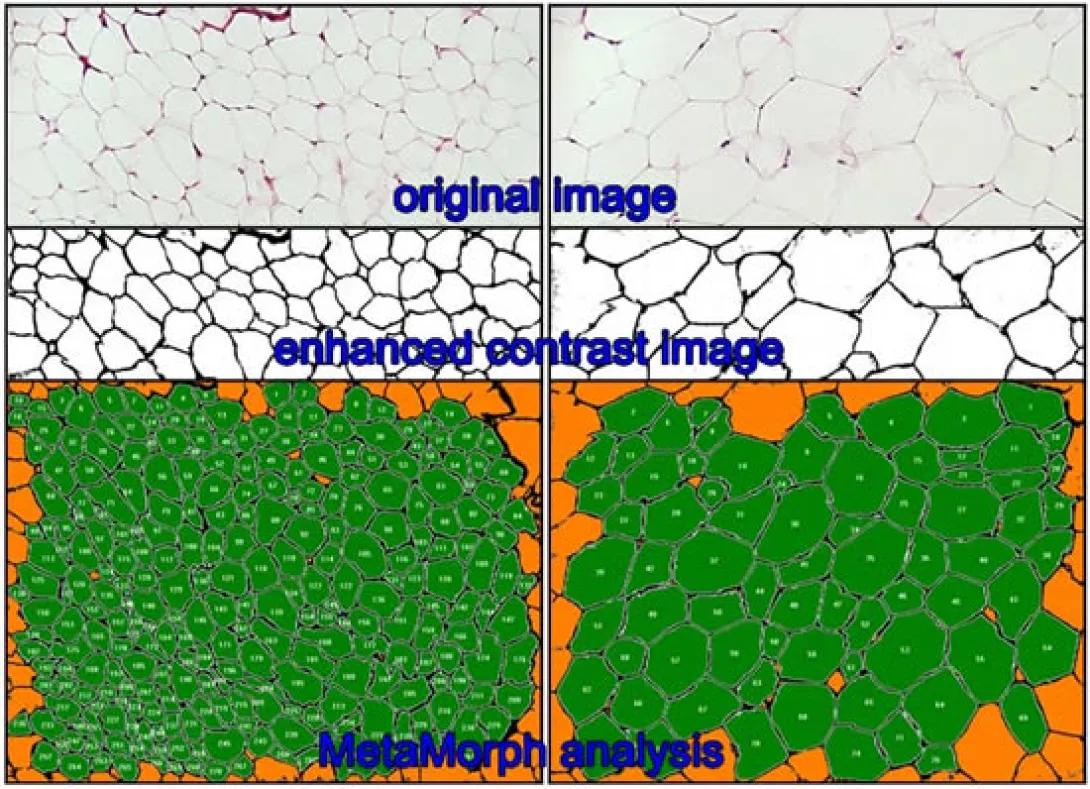
comparing images: original image, enhanced contrast image, and MetaMorph analysis
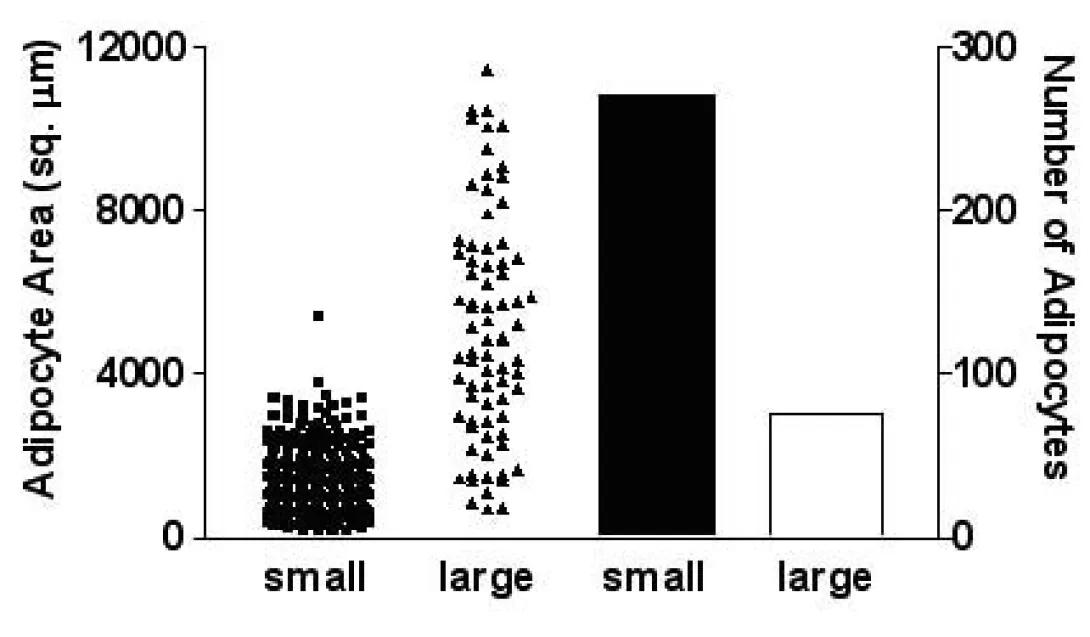
bar graph shows Adipocyte Area and number of Adipocytes in small and large
Morphometric Analysis/MATLAB
Microglia Activation Analysis
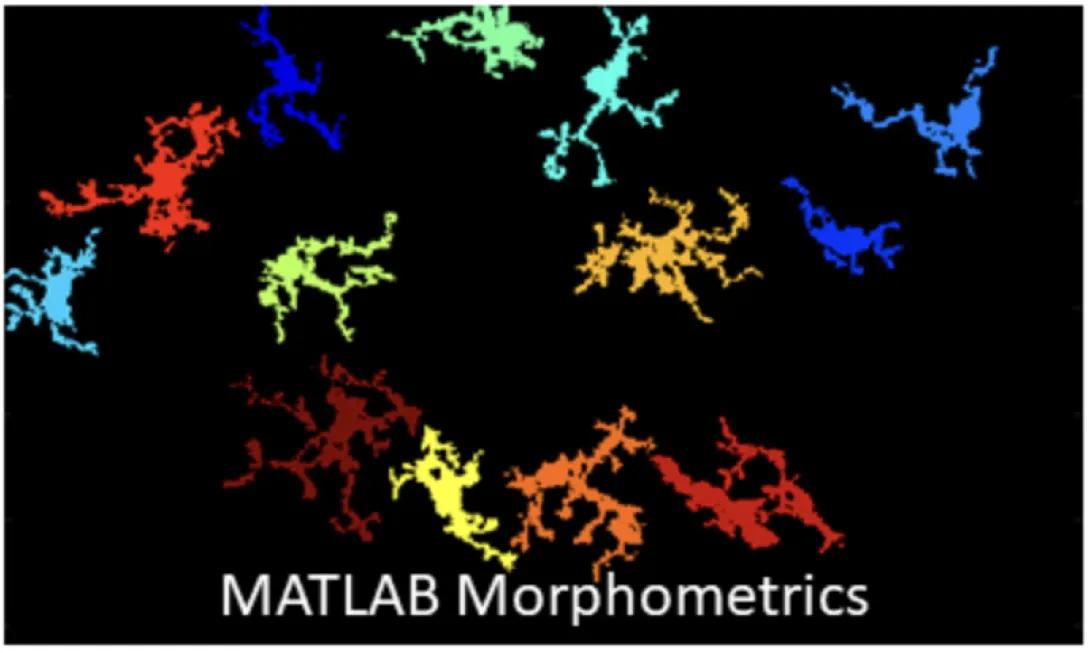
MATLAB Morphometrics
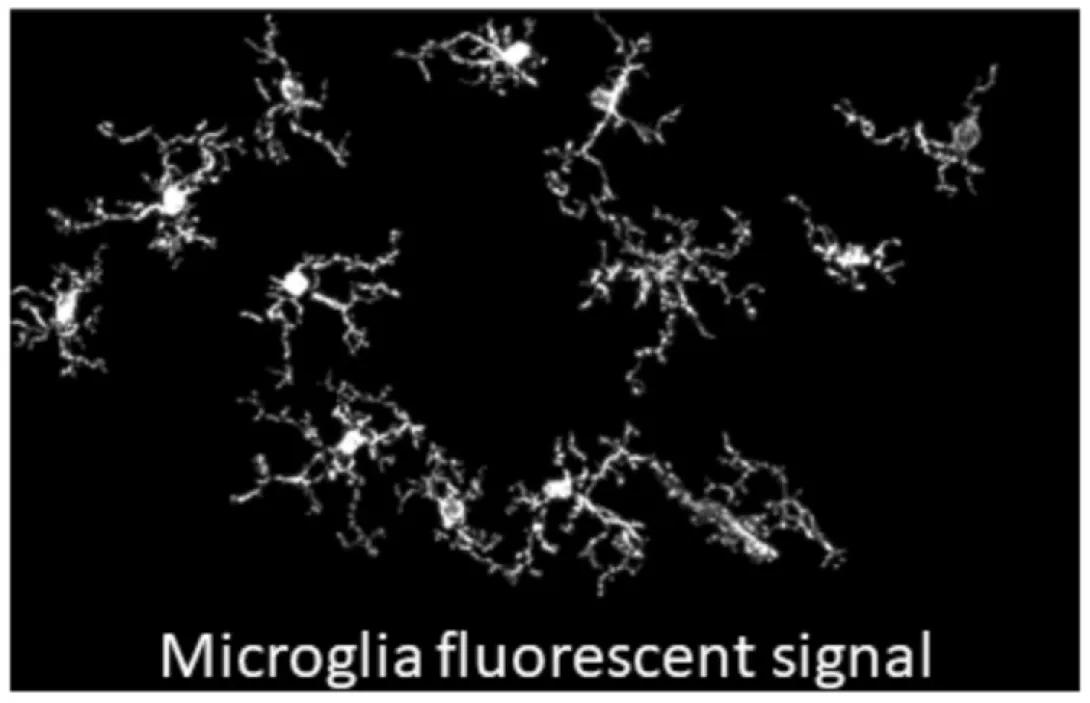
Microglia fluorescent signal
Aivia: Artificial Intelligence-Based Software
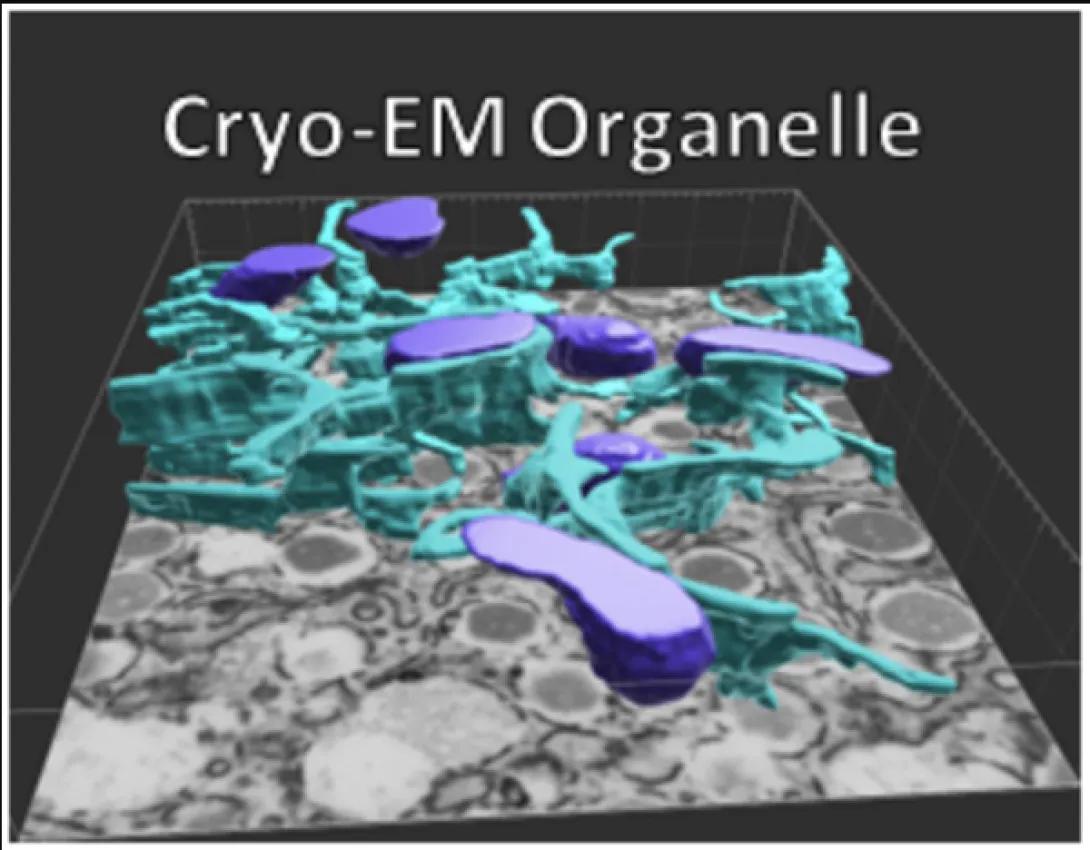
Cryo-EM Organelle
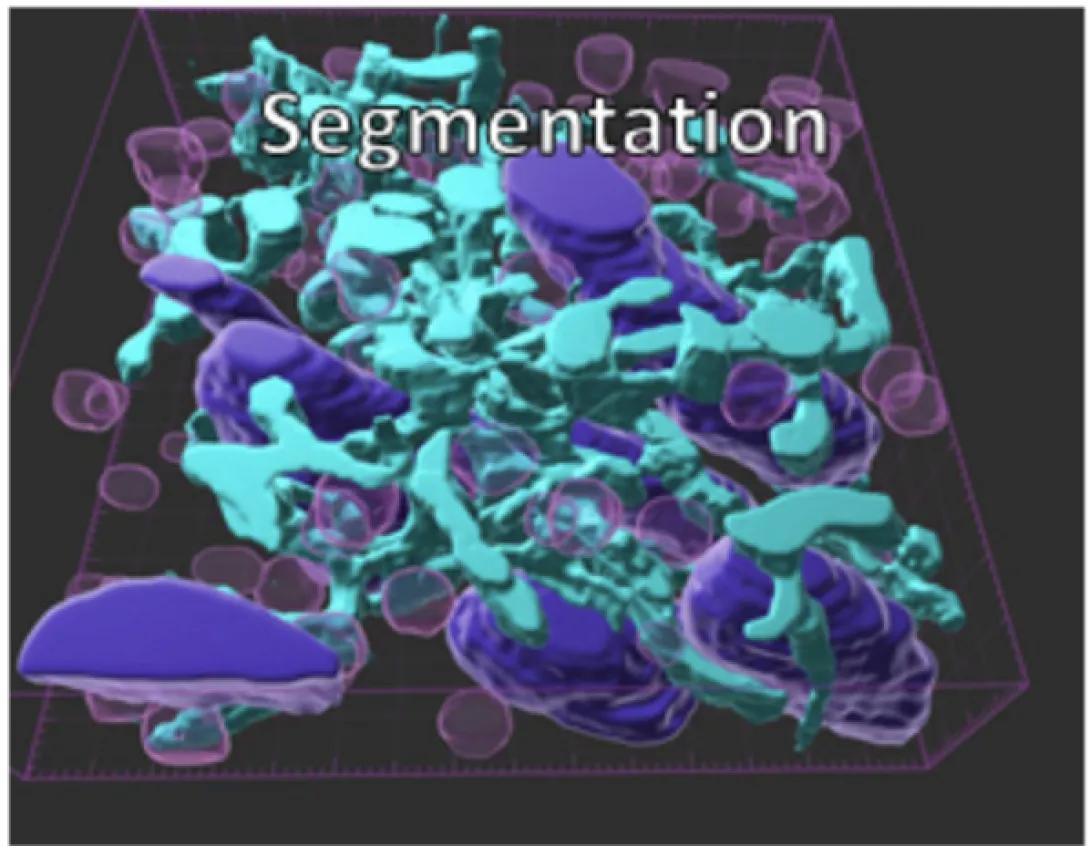
Segmentation
